


The web interface consists of seven different sections indicated by the navigation bar on the top. The button representing the active section is shown in a distinct color. The navigation bar is shared by all sections. Some sections may also contain a second bar on the top for invoking commands relate to that section. Navigating between the sections is straightforward by clicking the navigation buttons. At the end, there is also an eight button for switching to a full-screen mode.

Sections
Config
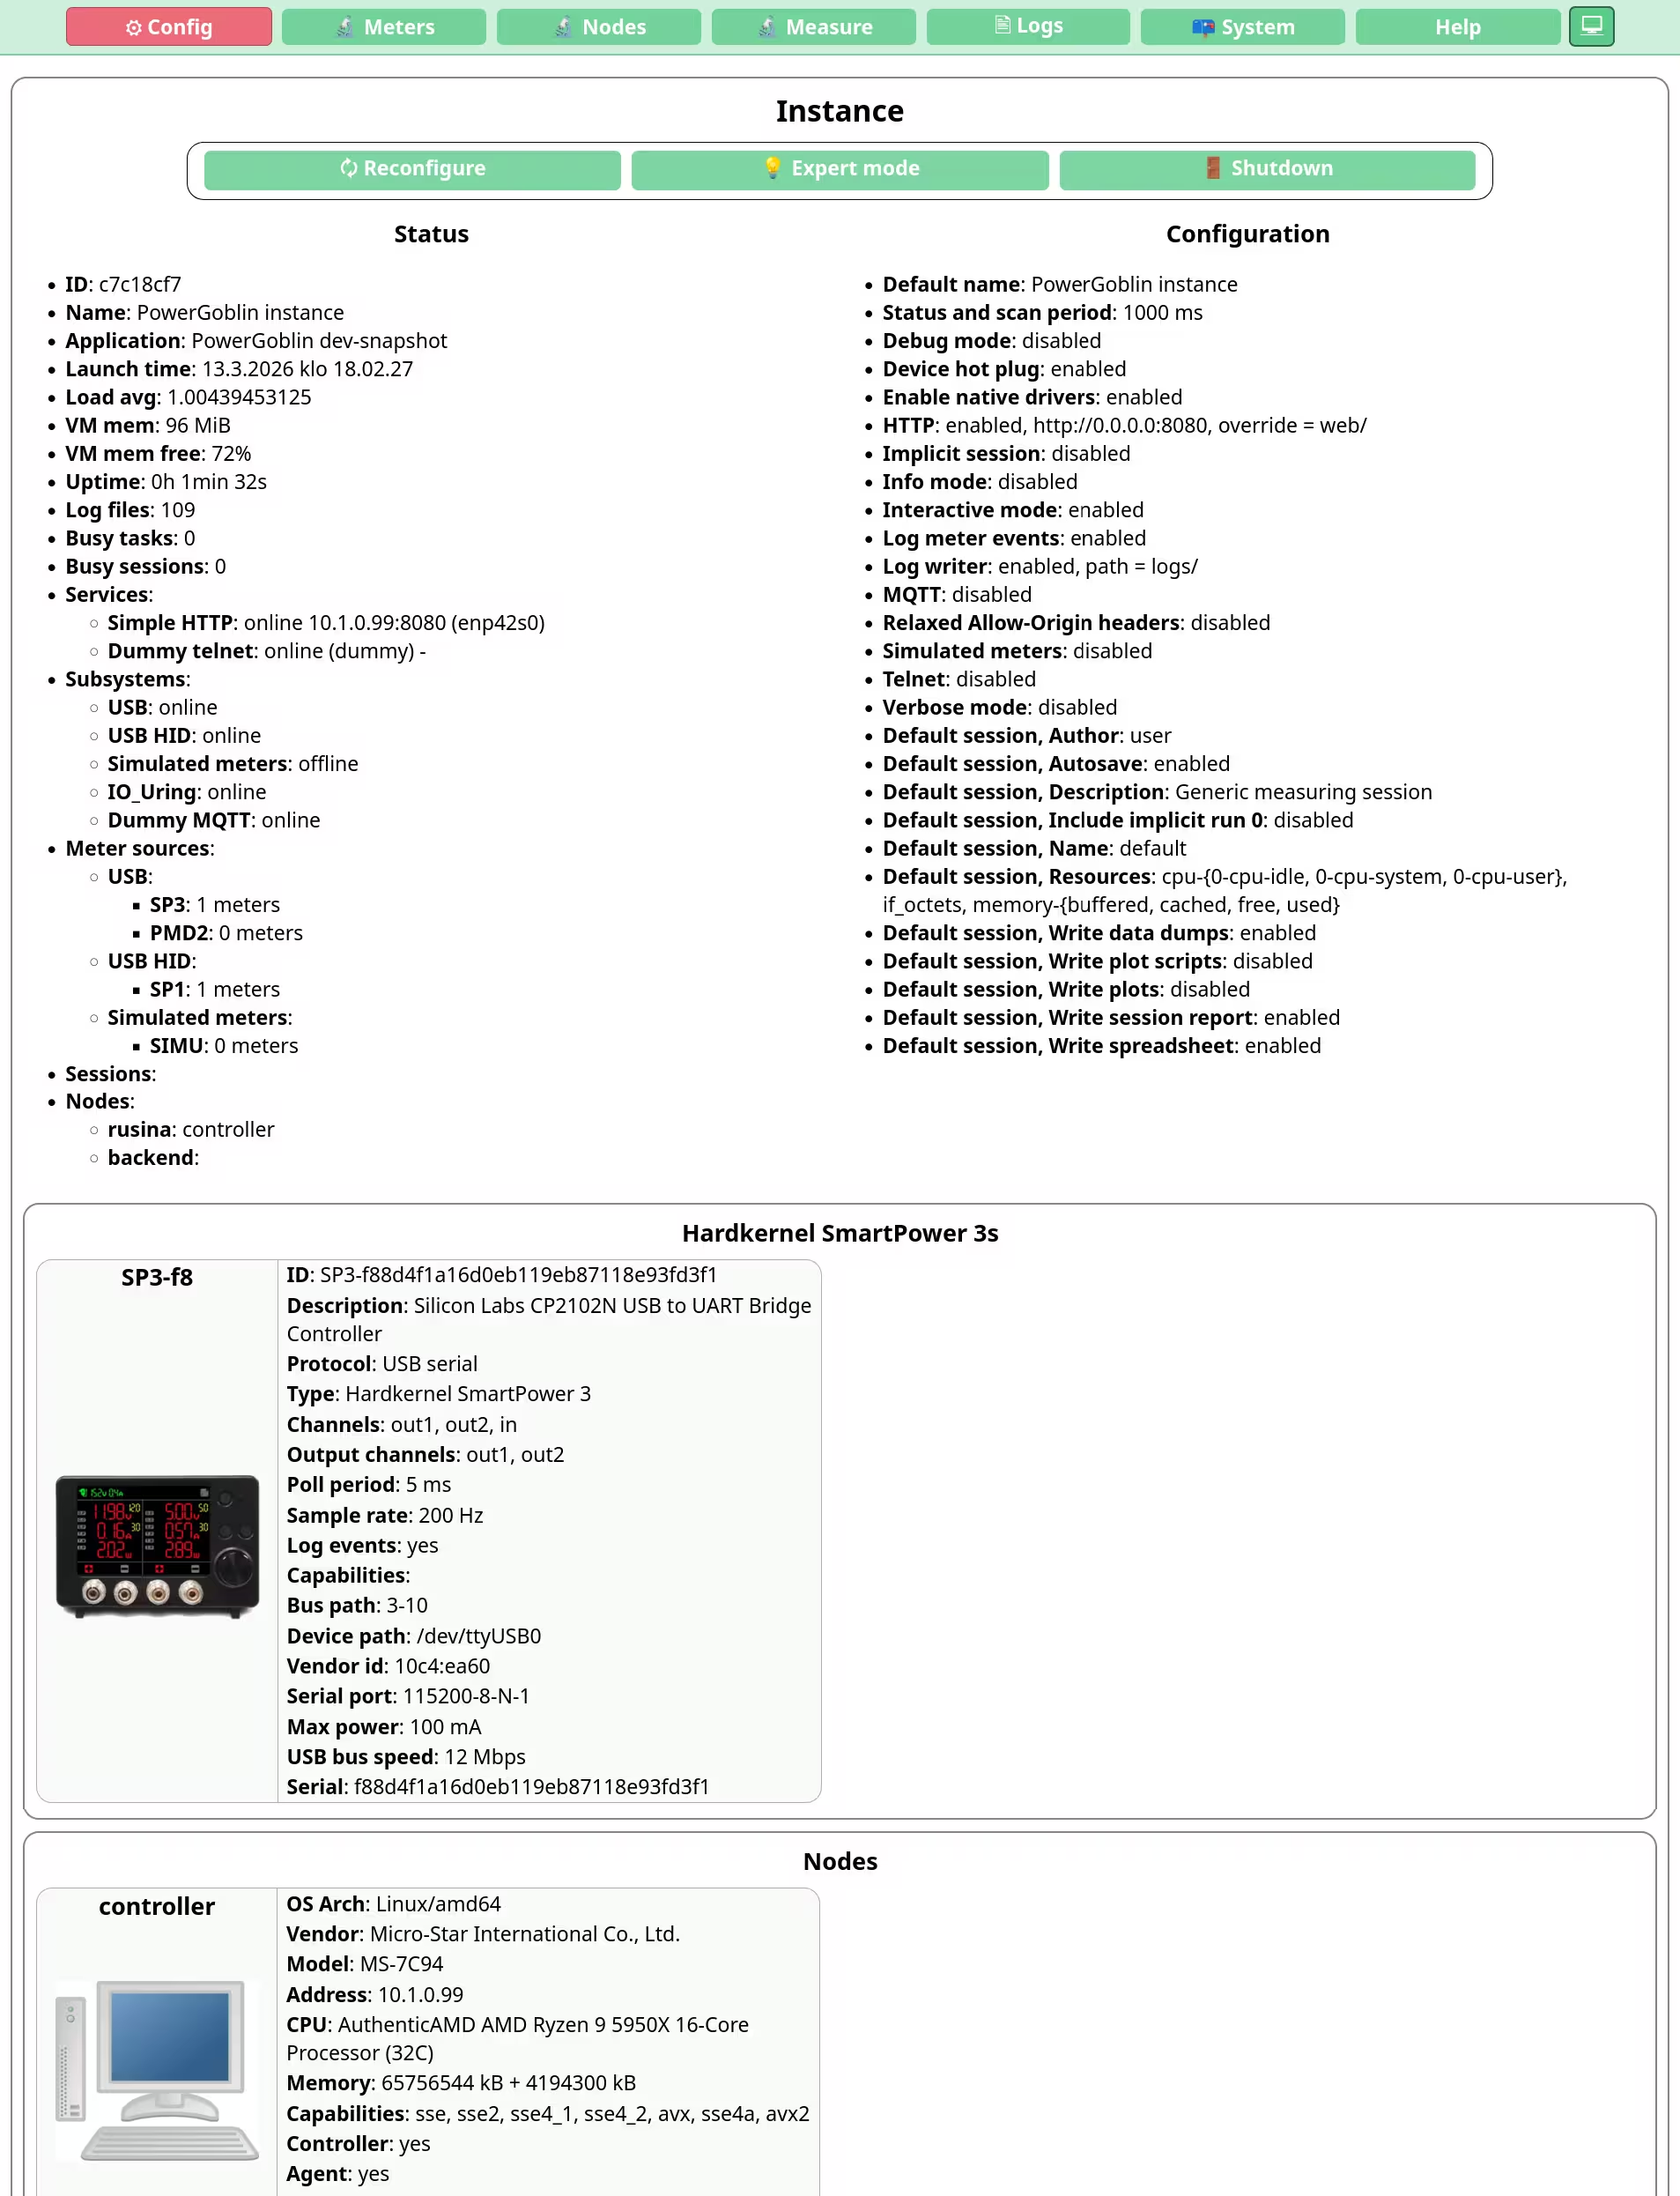
This section provides a dashboard-style view of all PowerGoblin meters available for the instance, both real and simulated. In this view, the static meter specifications and configuration parameters are shown. The meters are grouped by meter type. The command buttons available in this view also contains functionality for reinitializing the hardware and shutting down the whole instance.
This view does not provide any way to alter the configuration. Currently, very few settings overall can be changed at runtime. See the section about configuring the application if you need to modify some of these settings.
Meters
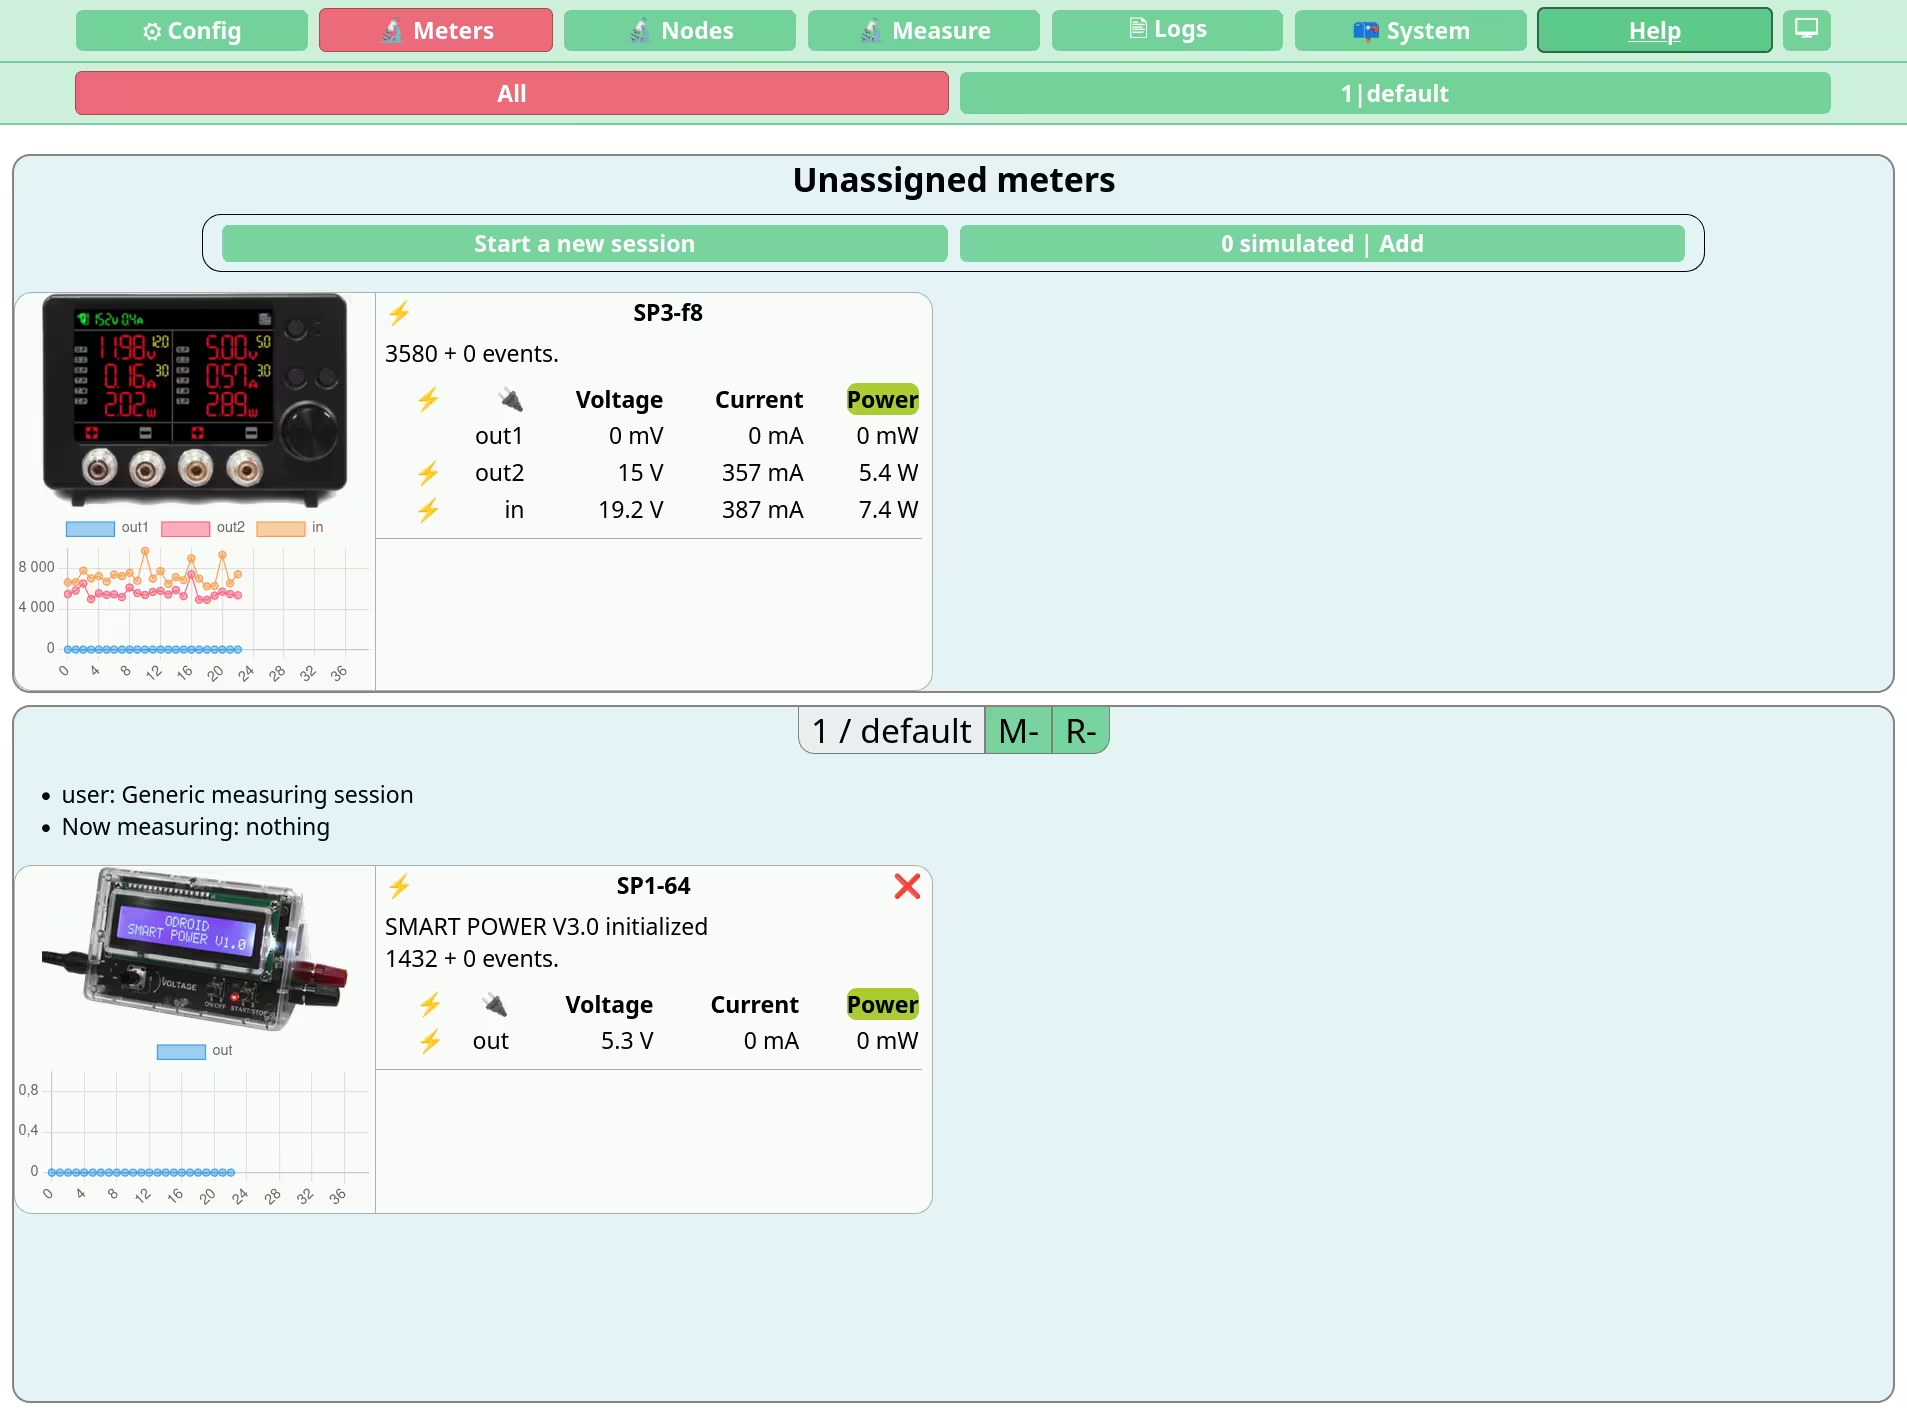
This section provides a dashboard-style view of all PowerGoblin meters available for the instance, both real and simulated. In this view, instead of the static meter specifications, their current voltage, current, and power values are shown. A live plot of the previous values is rendered below the image of the meter. You can switch between the voltage / current / power views by clicking these texts that appear as headers in the table on the right.
The meters are grouped by session and there is also a section for unassigned meters that are not part of any active session. The purpose of this view is mainly to observe the live status of the meters. A new measurement can be started here, but the existing measurements cannot be controlled via this view.
The view also provides functionality for filtering the meters of a specific session. The view is updated at a relatively fast rate (at the time of writing, the update rate is 500 ms).
Nodes
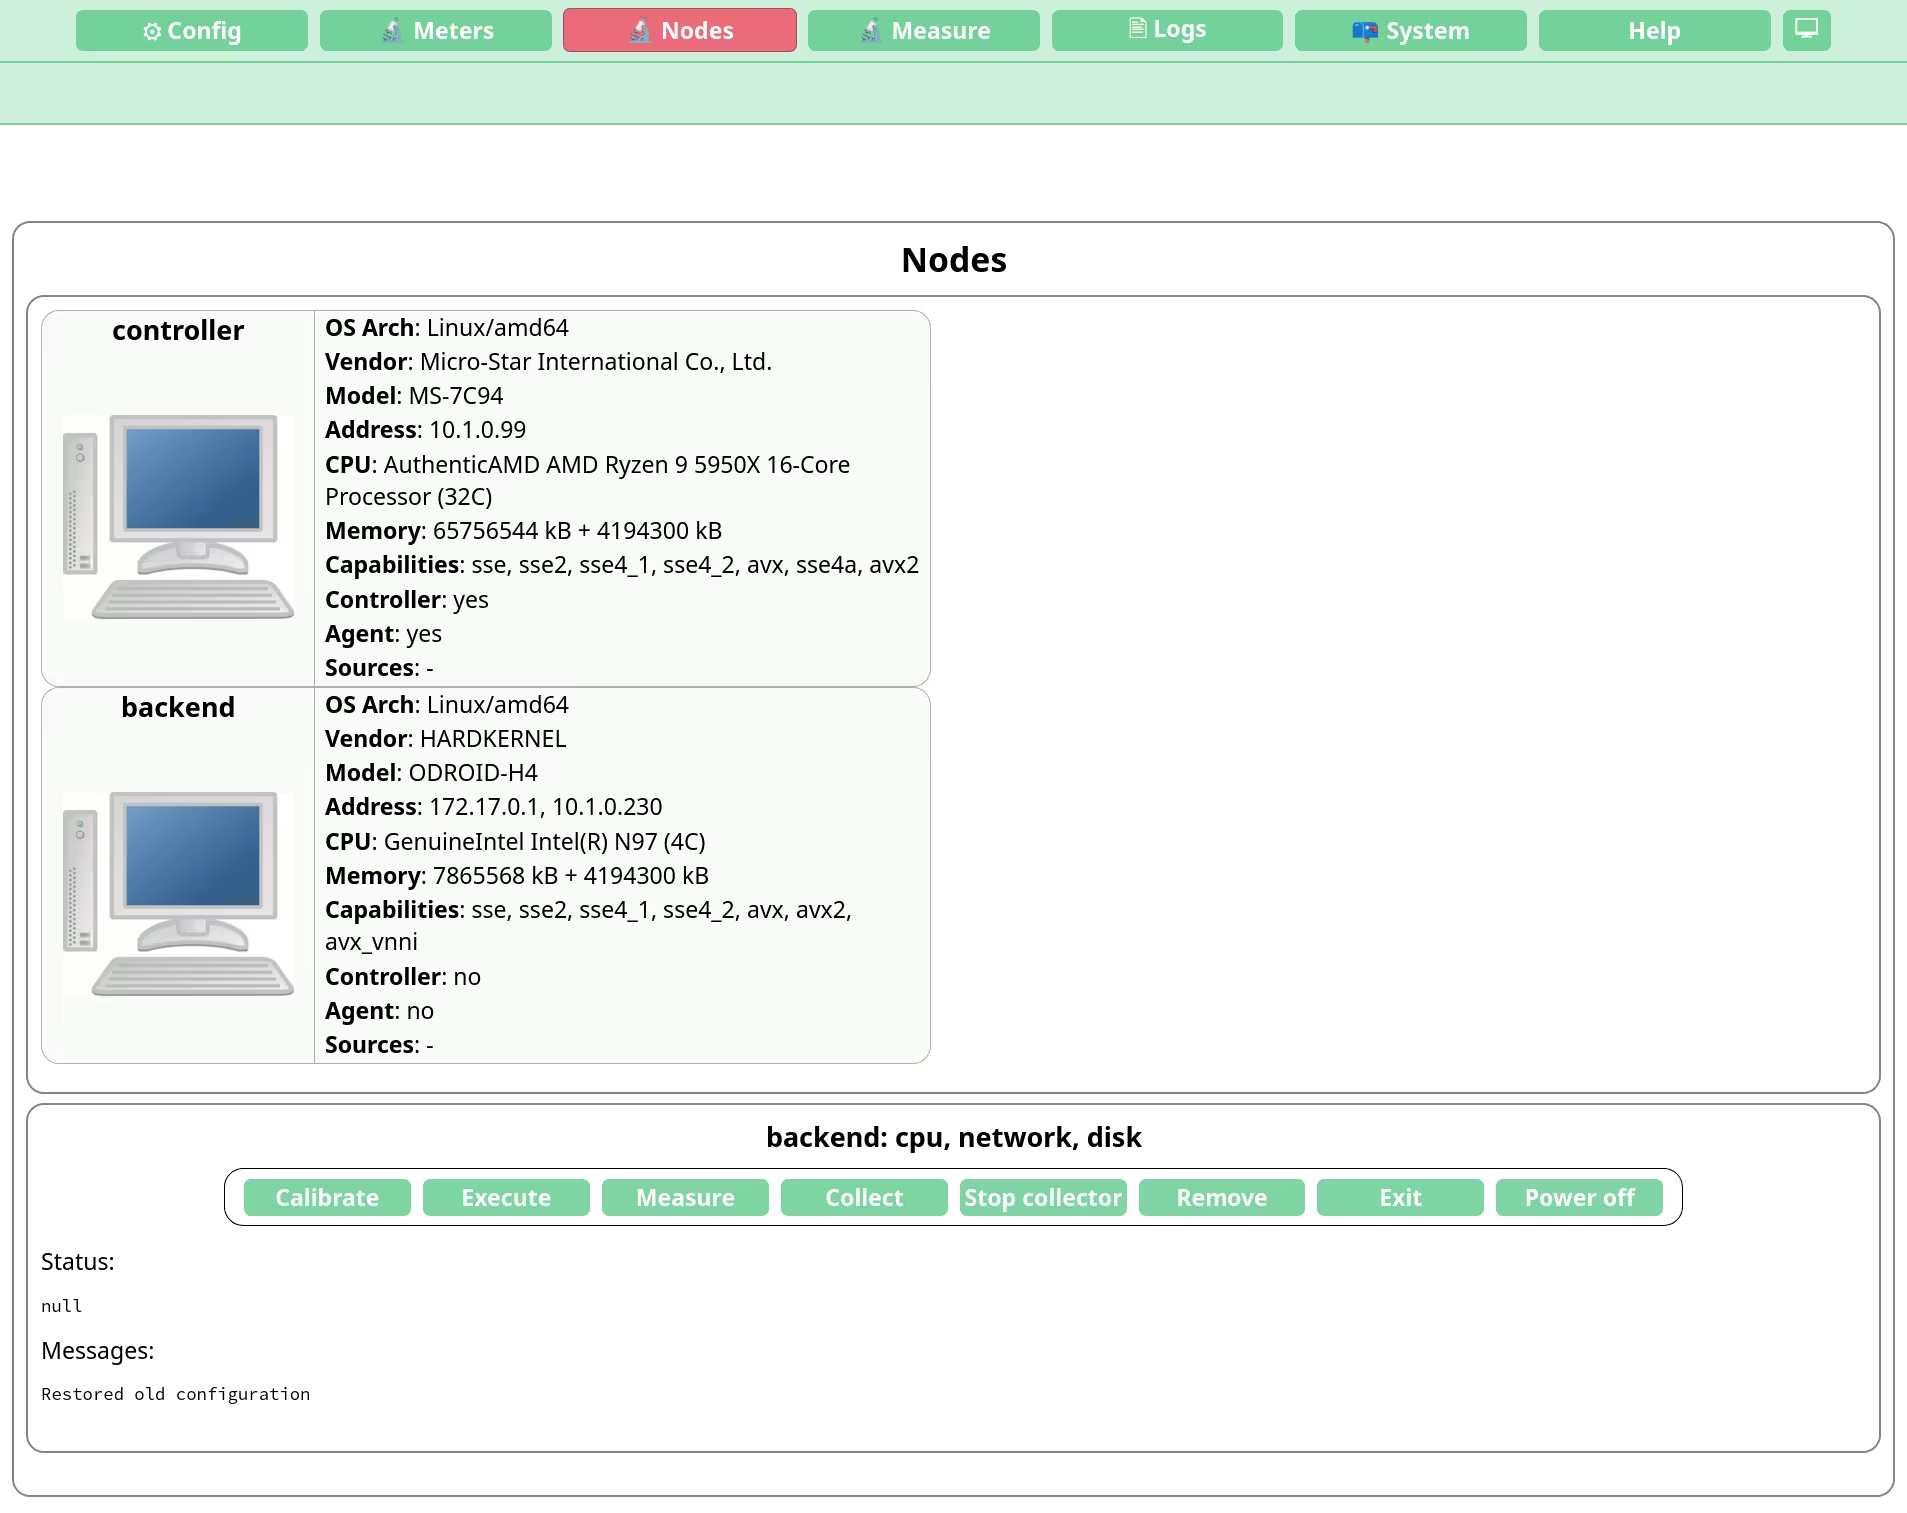
TODO
Measure
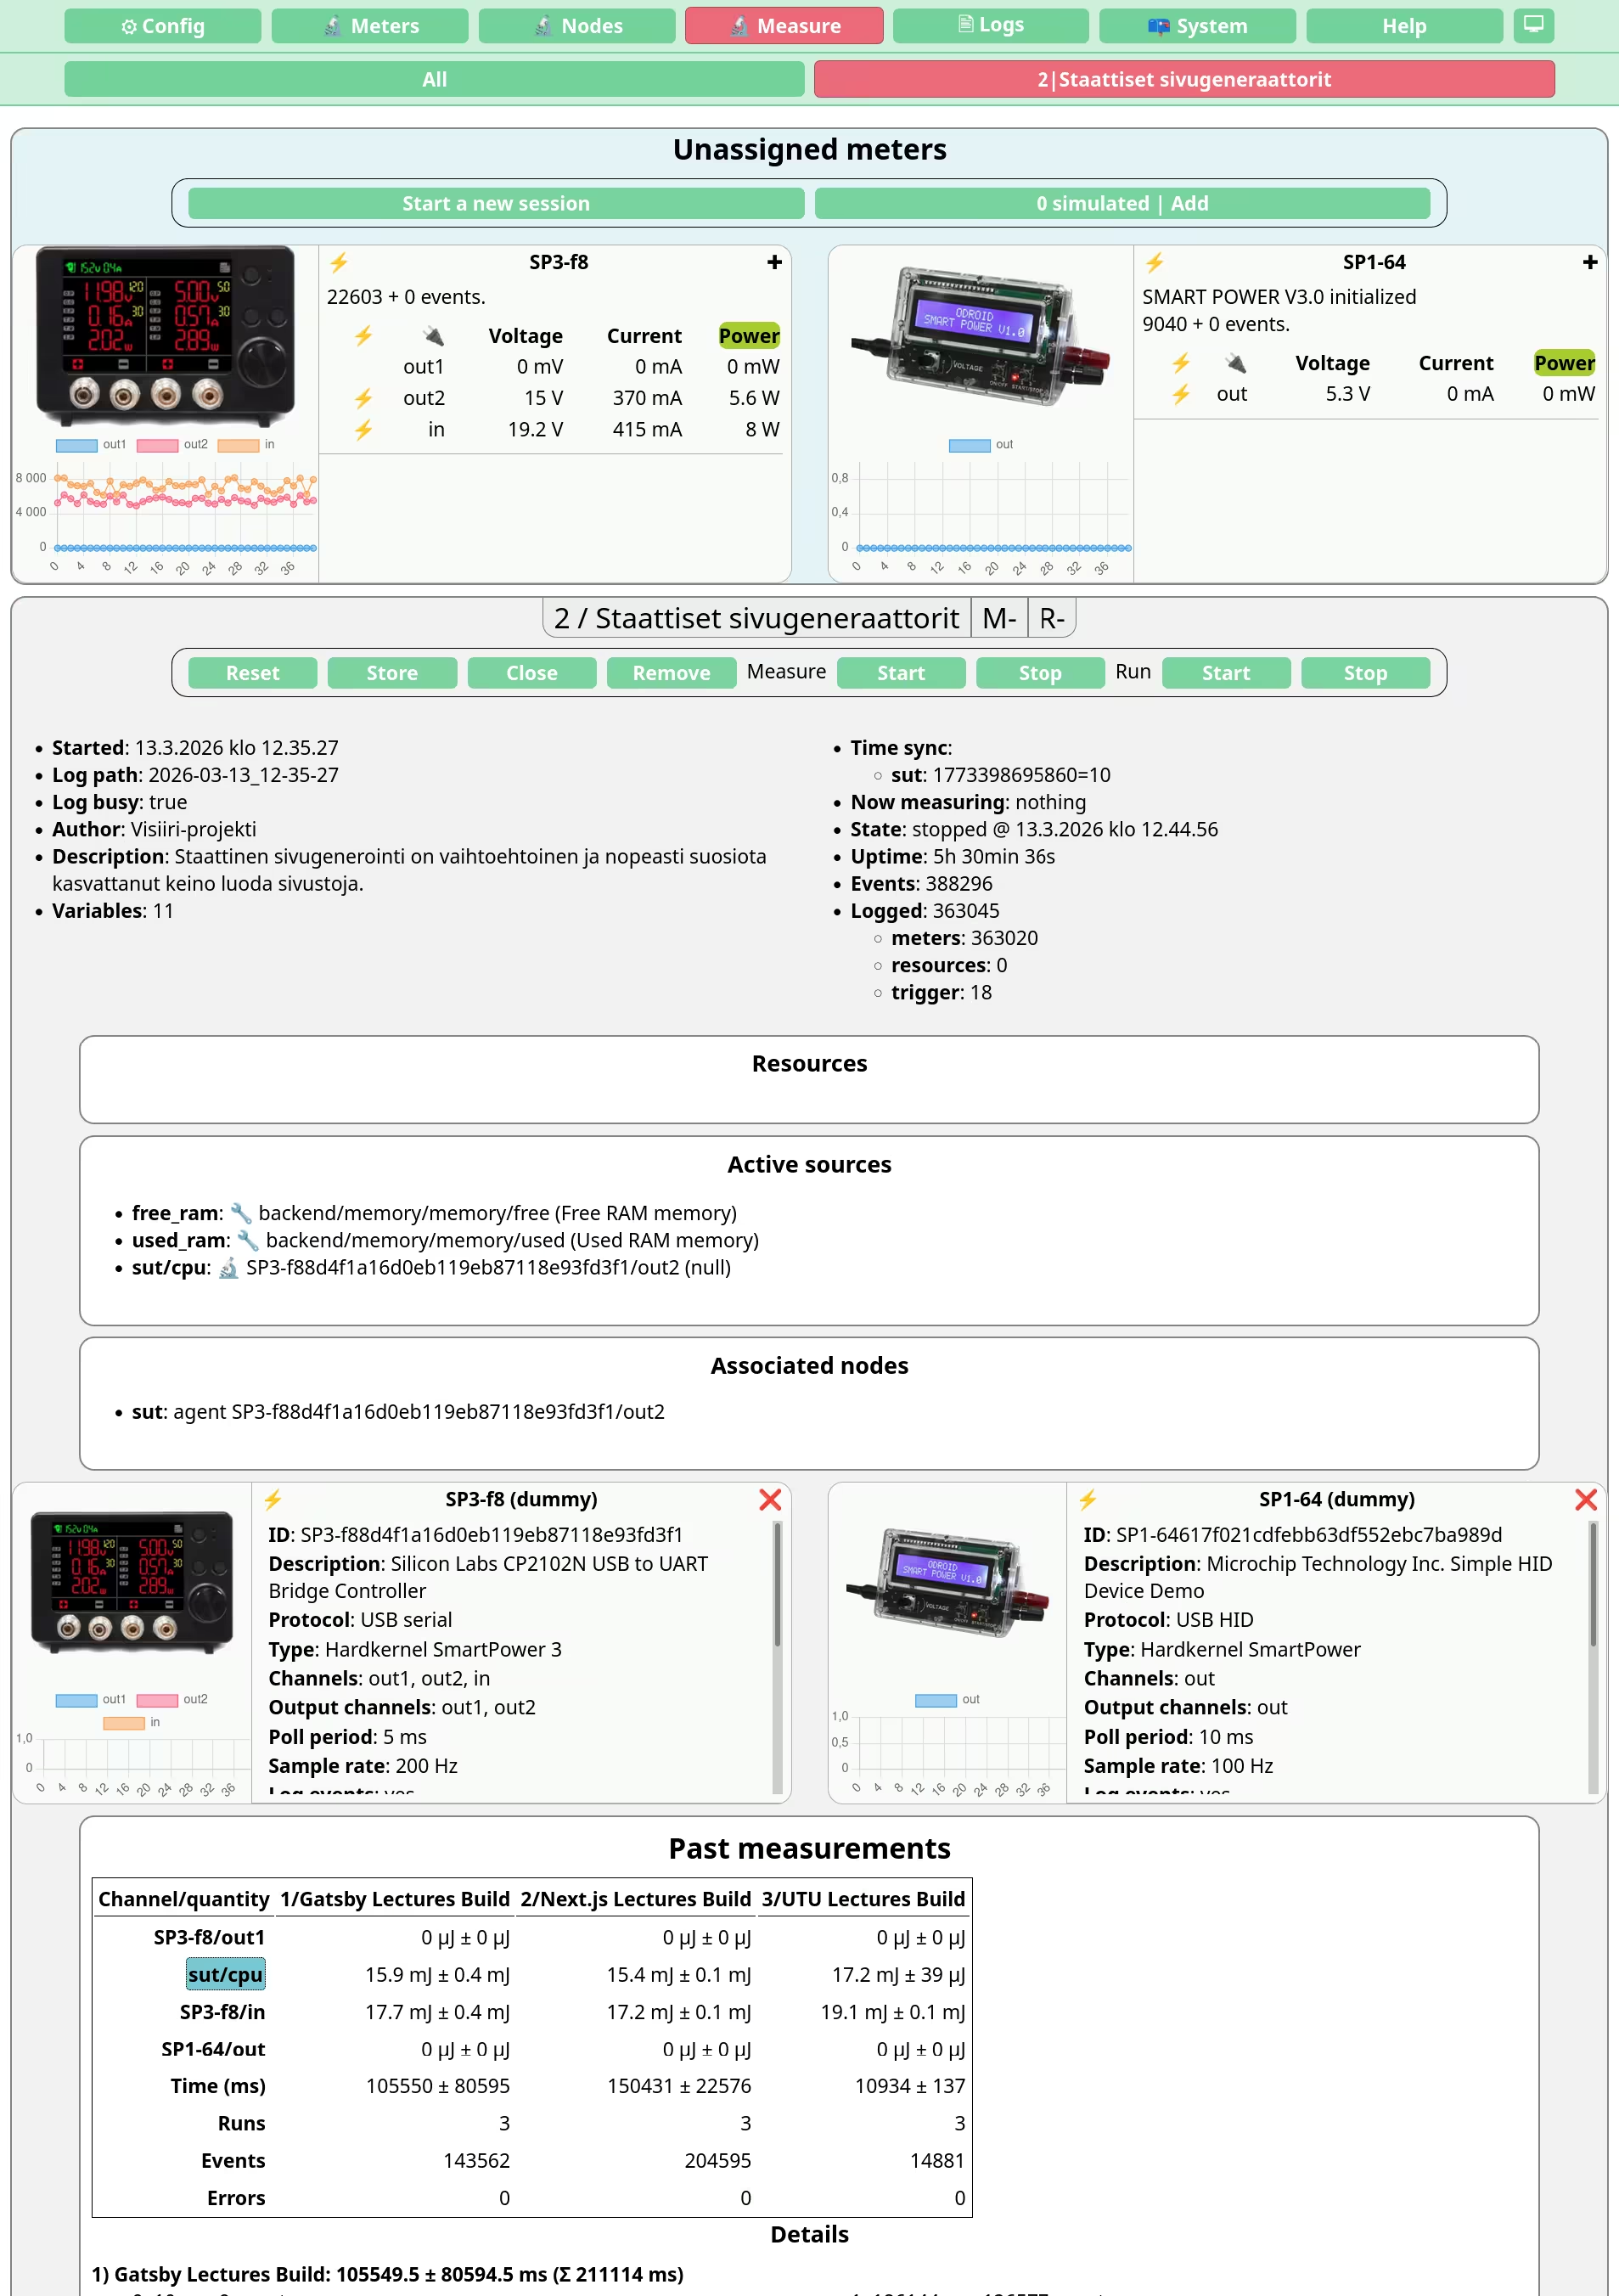
This section provides a dashboard-style view of the measurement session currently active on the instance.
On the top, the second navigation bar lets us choose the active session or create a new one, if no sessions exist yet. If there is only a single session active, it is automatically selected as the active session.
For each active session, there is a section under the top navigation. In each session section, a third bar with buttons is located on top of the section. It contains operations for manually controlling that session. The session can be reset (all events and resource data will be deleted), stored on disk, closed (unassigns the meters and sets a stop time), removed (closes the session and removes it from the instance).
Inside the session, measurements can be started and stopped. A measurement is supposed to present a single test case. If there is a need for repeating the same measurement, new runs can be started and stopped as well.
The header of the session view shows the name, the current measurement and the current run associated with the session. All the sections are color coded: the list of unassigned meters is always blue, a started session is green, a session with an active measurement is red, and a closed session is gray. The session view also shows general session related information, then a dashboard view of the associated meters, associated log files, associated measurements and/or runs, and finally for closed sessions a graph for visualizing the latest measurement with a scatter plot. A control bar is also shown for choosing the channel to display.
Logs
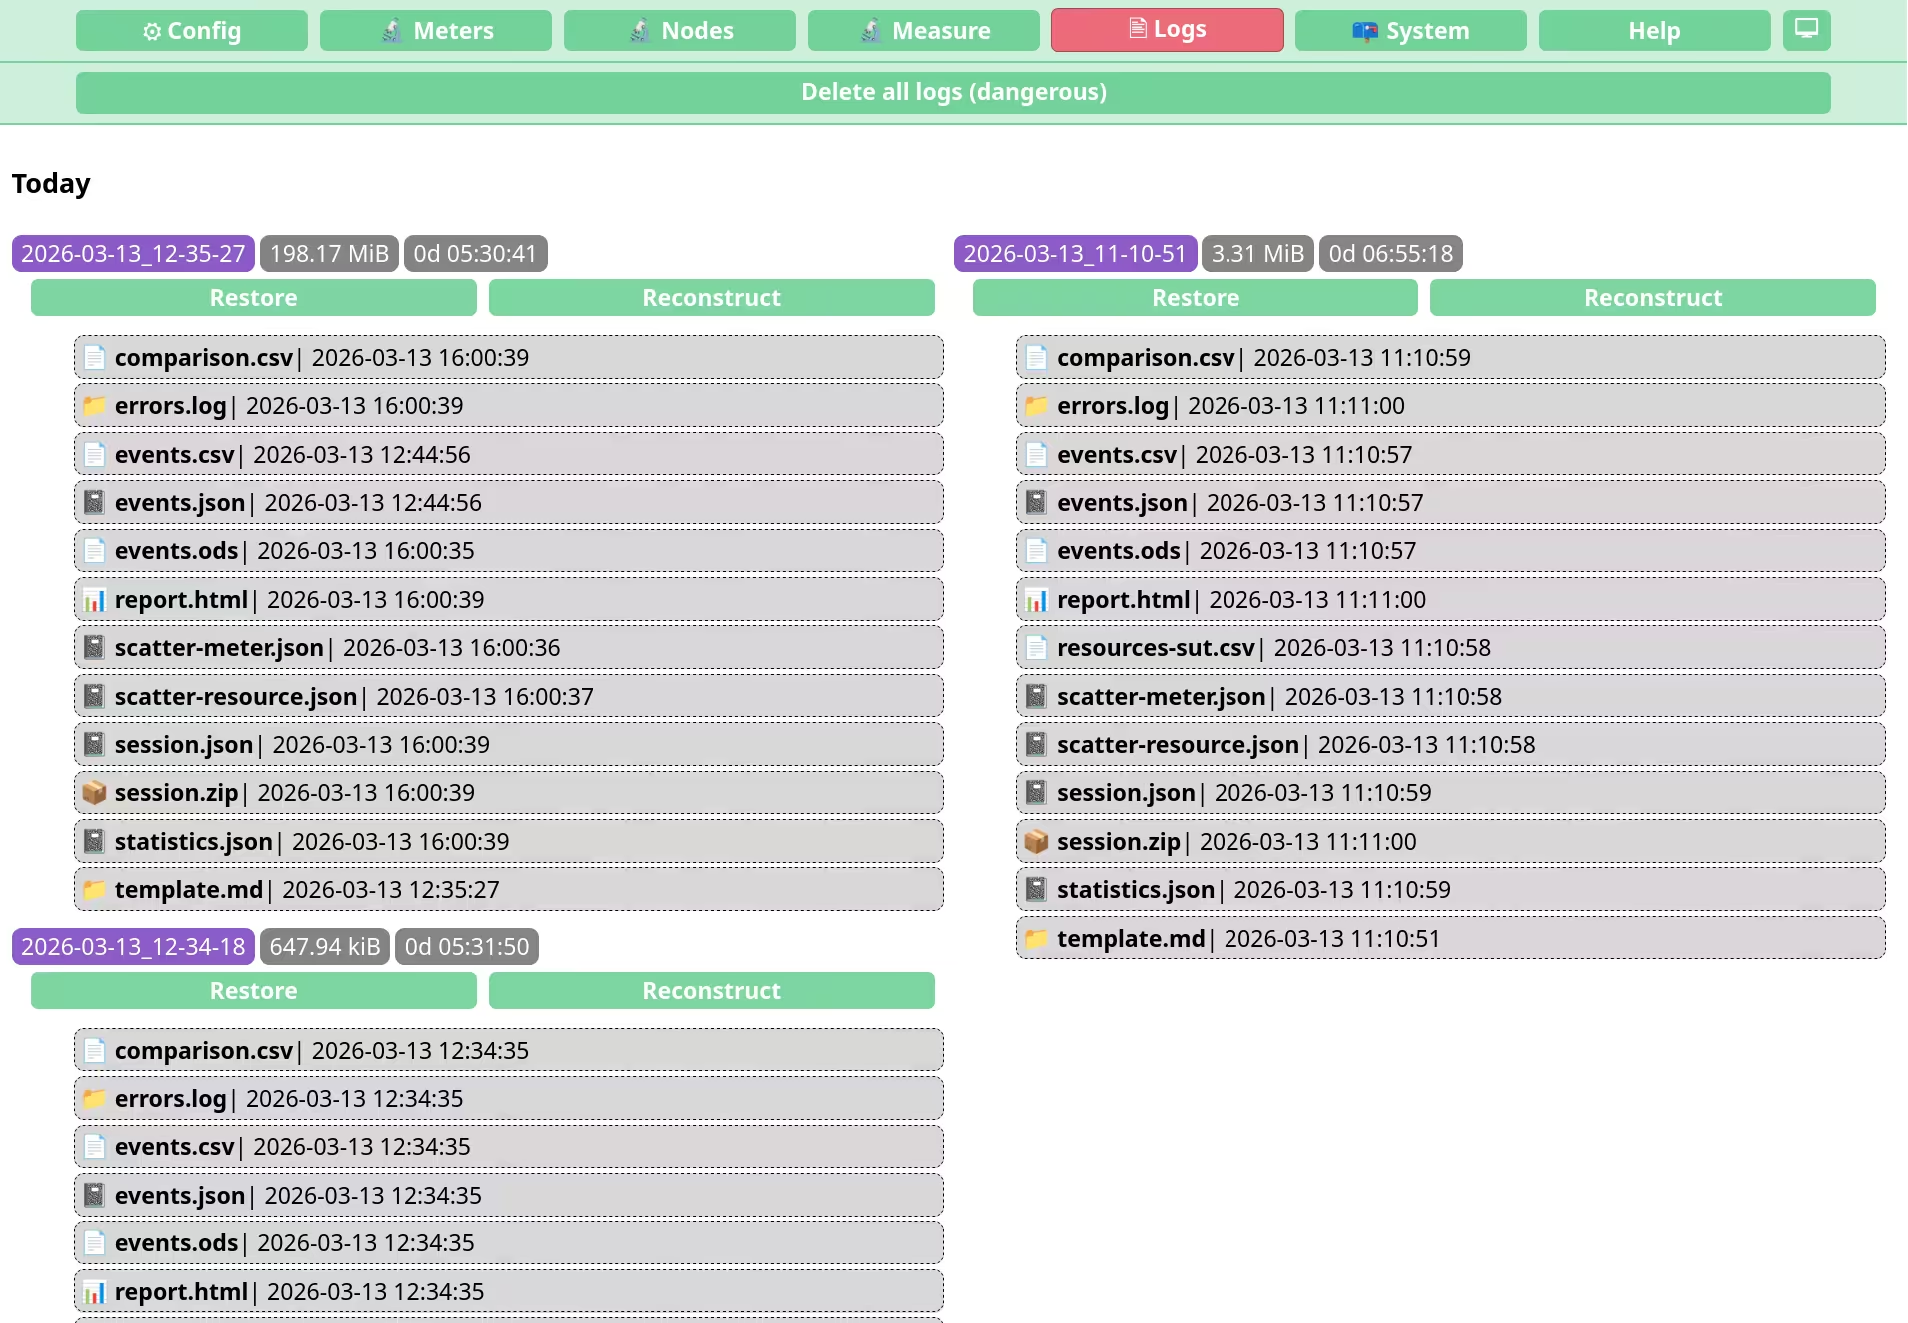
This section lists all the previous sessions stored on disk. Individual log files can be studied in this view and whole sessions can be restored for further analysis. If the session is generated with an incompatible previous version of the software or otherwise broken, a text "Corrupted" appears next to the session directory name.
The section also contains a button for deleting all the logs. There is no safety mechanism for preventing accidental deletion of data.
System
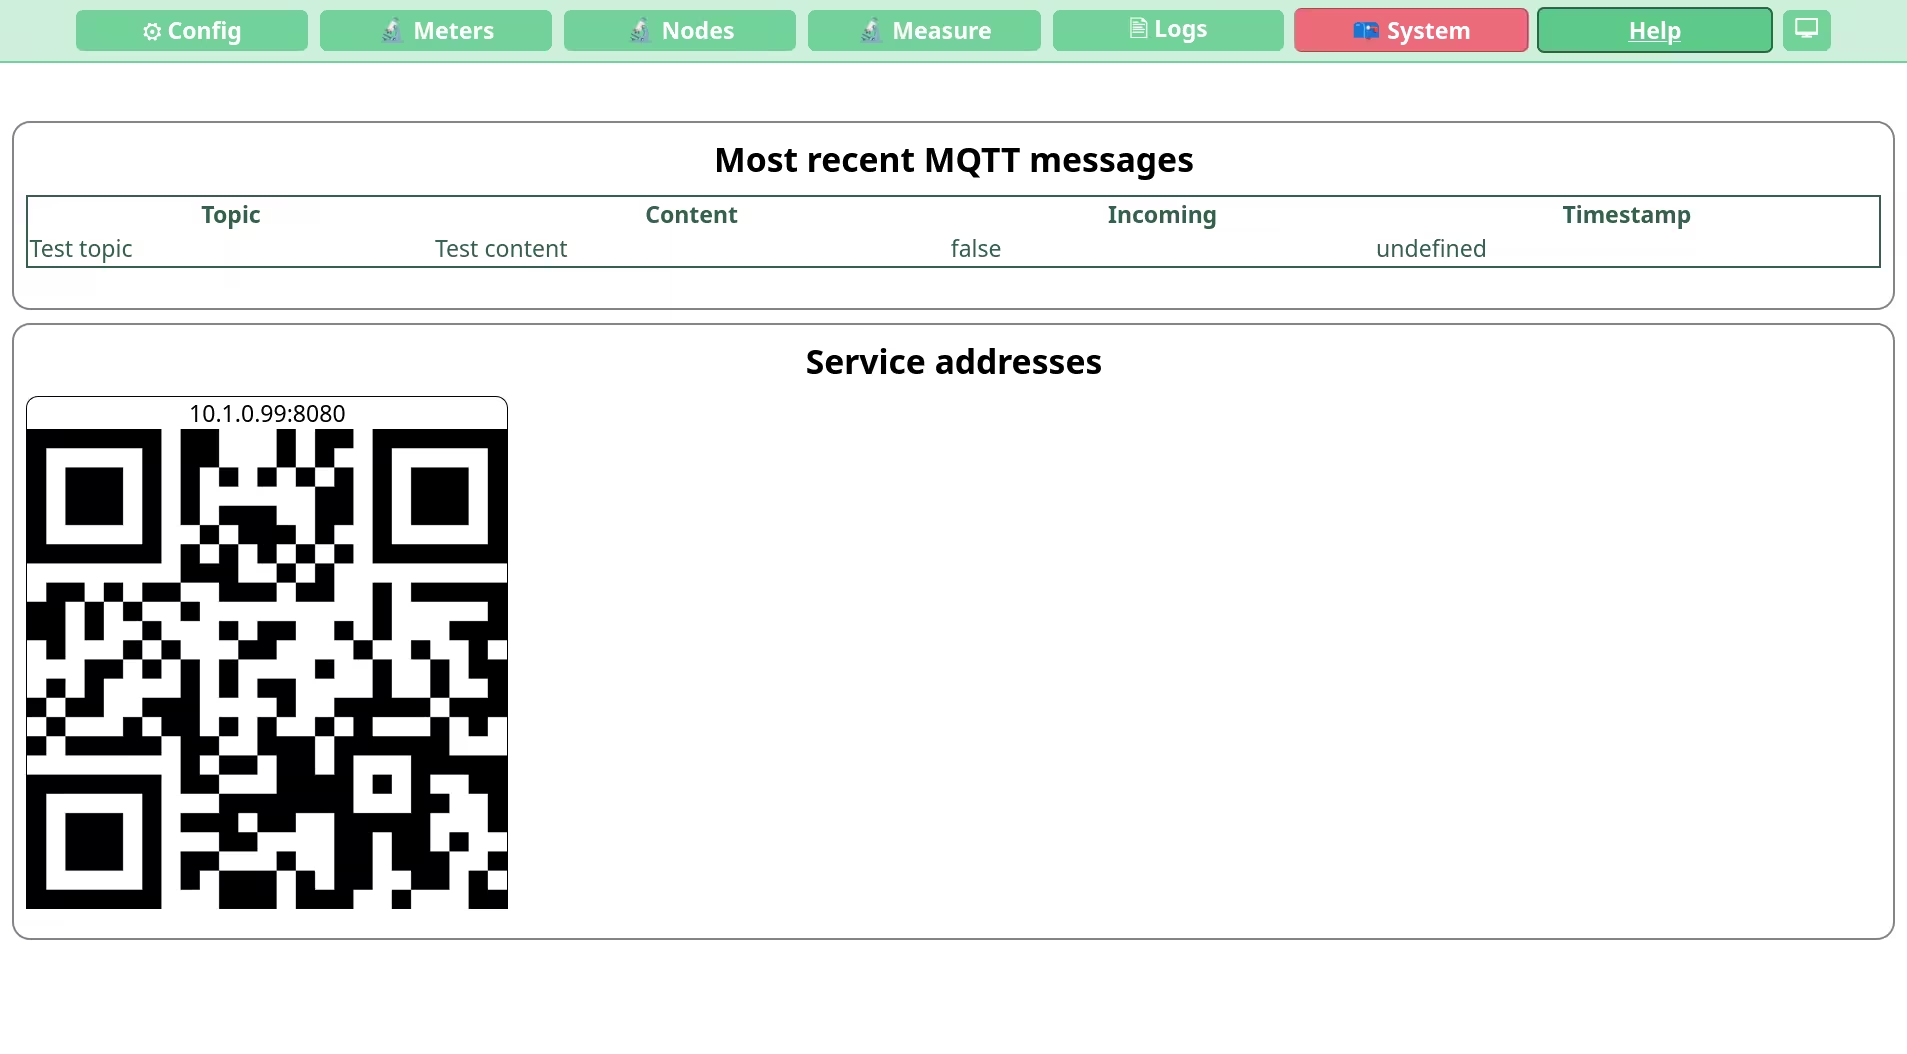
This view consists of three sections.
The first section shows the latest MQTT messages connected to the measurement instance. This is currently unimplemented until the MQTT support has been re-enabled.
The third section contains listings for analyzing system logs. The lsusb listing shows the USB devices detected by the OS. The lspci listing shows the PCI / PCI Express devices detected by the OS. The ip addr listing show the list of active network interfaces and their configuration.
Help
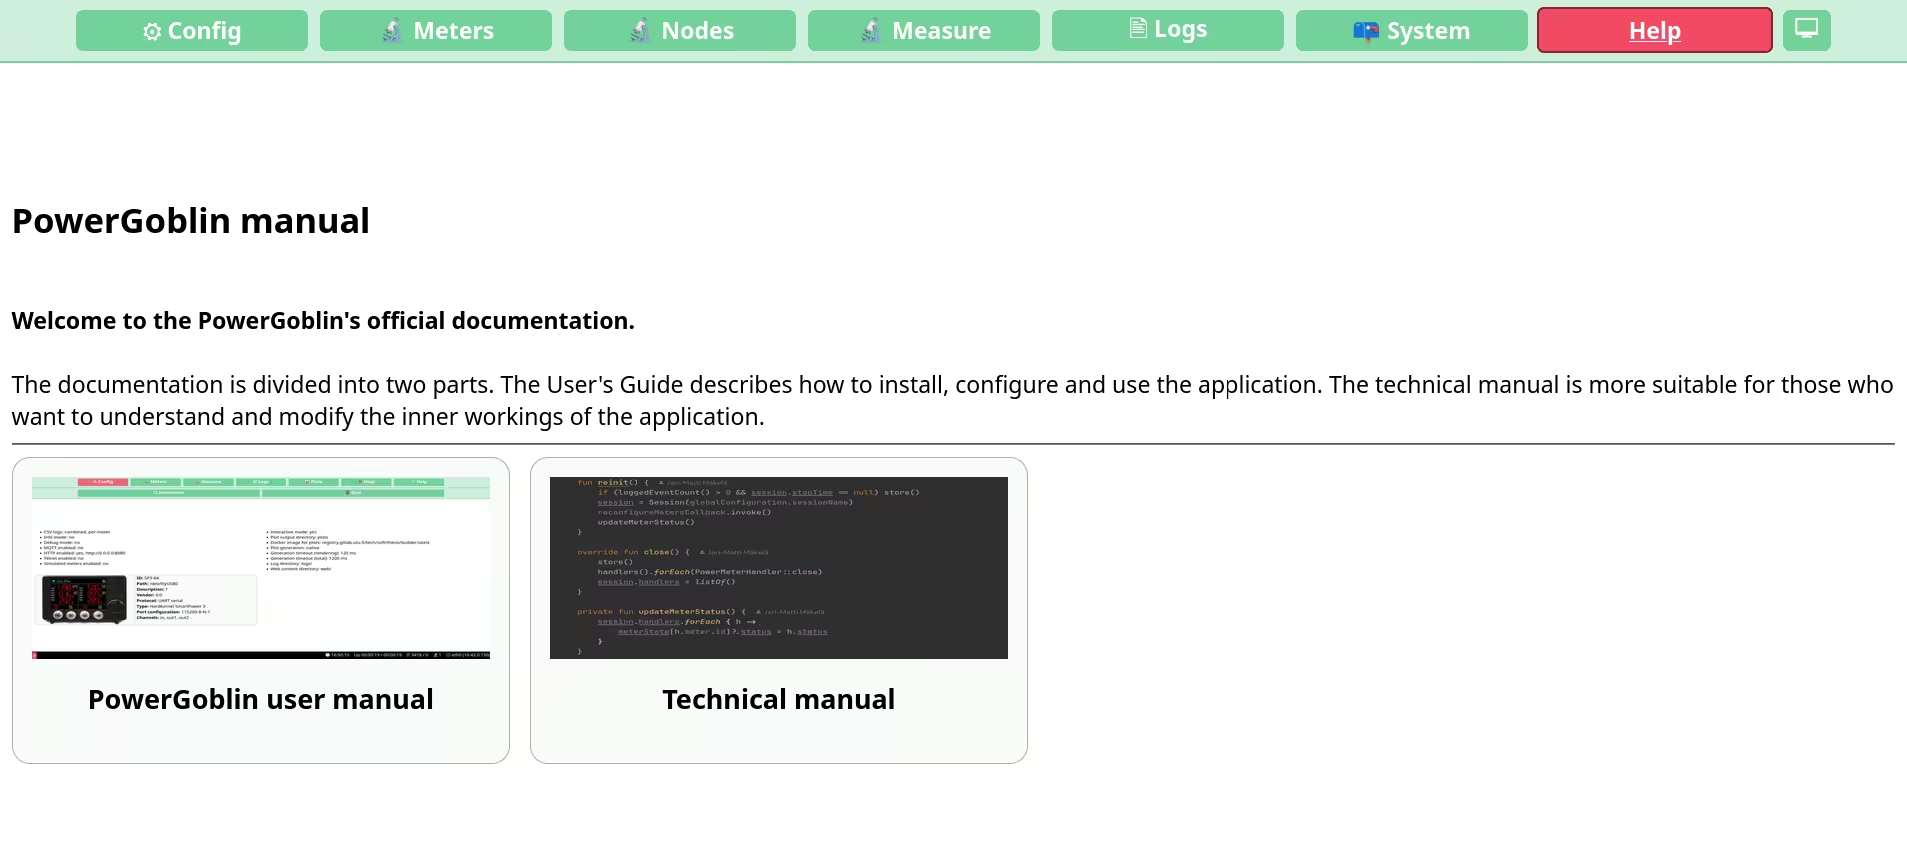
This section contains the manual for the application. The actual up-to-date manual is available online. This section actually just redirects to the official manual.
Command console
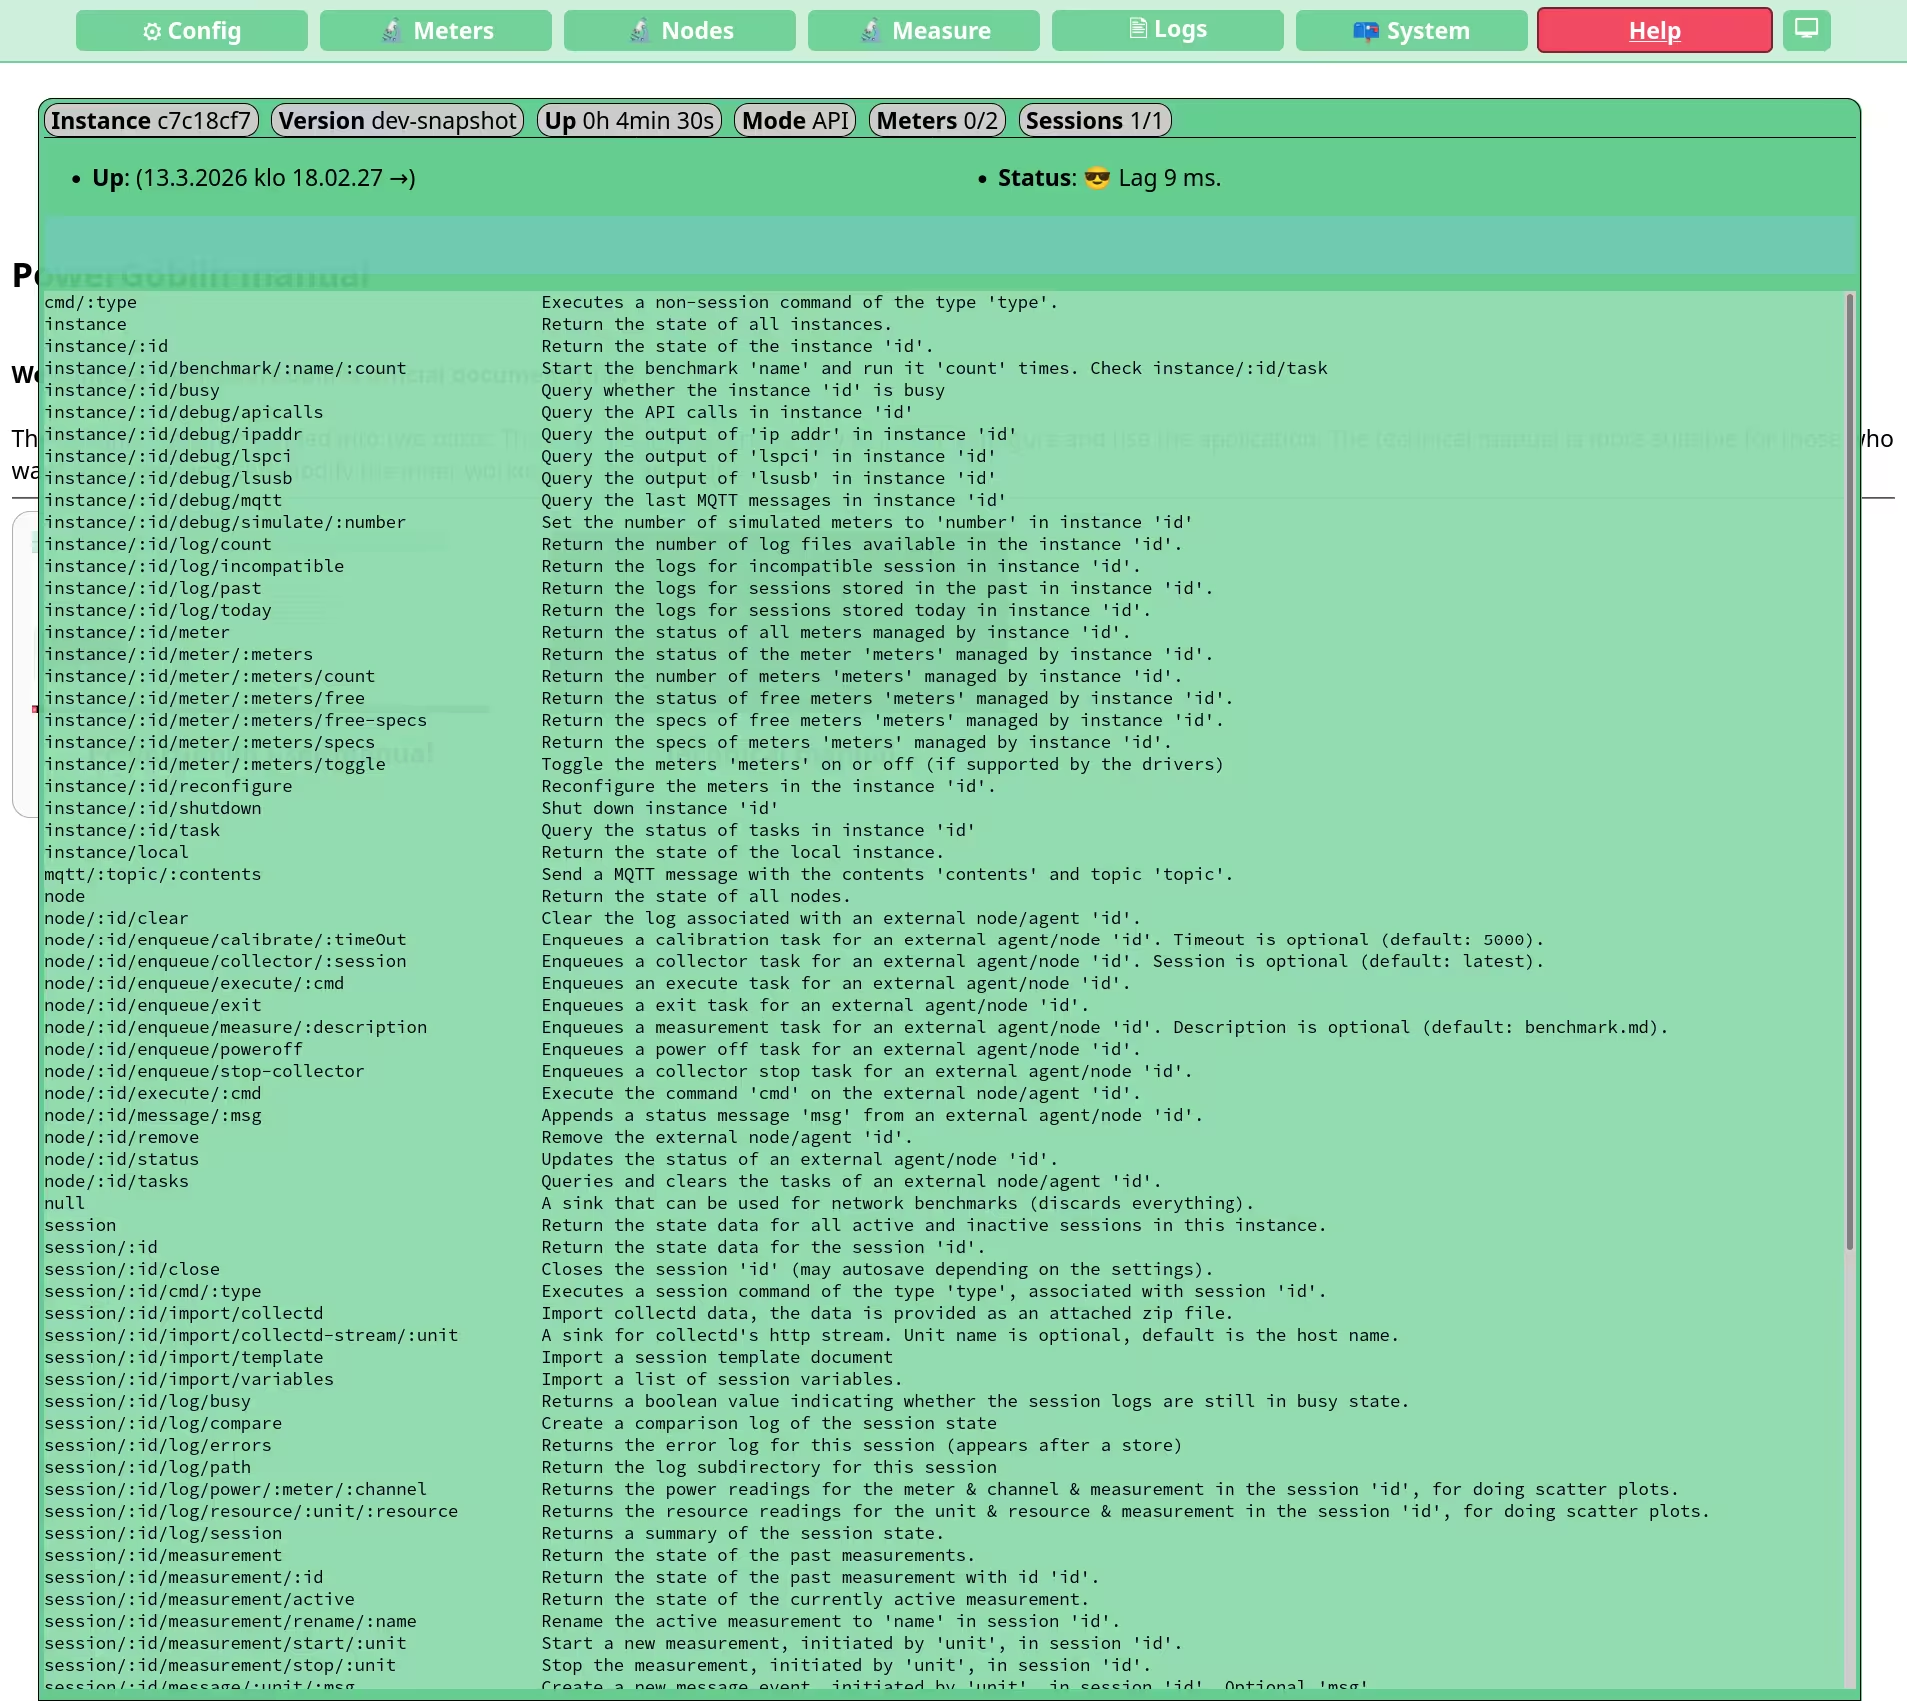
You can access and hide the console in any of the previous sections by pressing 'Esc'. This widget is rendered on top of the section content, and allows you to control the PowerGoblin instance manually from the browser using the PowerGoblin's HTTP GET API (v2). Use the text input box for writing API queries. Pressing 'Enter' will send the request. Pressing 'Tab' or 'Delete' will auto-complete the query. 'Caps lock' will switch between different views.
The widget also displays real-time statistics (uptime, addresses, number of events, etc.) of the PowerGoblin instance.
Message view
The notification area for new messages will activate whenever important messages are broadcasted by the backend. You can press F1 to display the very latest messages. The full list of messages is available via the command console.