Power

Goblin




- Plan
- Agent
- Agent's directory structure
- Obtaining projects
- Measurement plan description
- Markdown document
- Next step: Setting up a measurement plan
Plan
This section documents the structure of the measurement plans. The plan describes how the measurement should be performed. When starting a new session based on a plan, the plan can be even used to ensure that all required meters and nodes are available in the execution environment.
Agent
The purpose of the agent is to manage the execution of measurements on the nodes. Typically the agent is used to initialize measurement described with measurement plans. The agent can also perform preparatory tasks. It can, for example, enumerate the available measurement plans, download zip archives of measurement projects, power off or reboot the node, execute arbitrary commands (no security checks in place!), and calibrate the meters.
PowerGoblin has a layered structure. The first iteration of PowerGoblin only had support for a single session per execution. Later, support for concurrent sessions was added. As more and more features were added to describe and configure a session, instead of defining new API endpoints for each new feature, a plan description file was developed. This file can be used to describe all aspects relevant for a measurement session.
Agent's directory structure
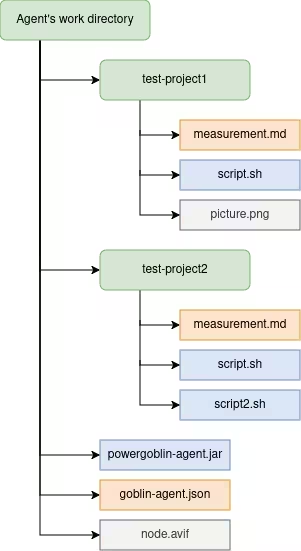
The image on the right demonstrates the directory structure on a node managed by the PowerGoblin agent. First, the powergoblin-agent.jar must be located somewhere. If we start the agent with java -jar, we can assume that the same directory will be used as the working directory for the agent process. Everything else will be located in the same directory tree. More advanced users can define another working directory with e.g. systemd units, but that will not be covered here.
Next, after starting the agent for the first time, the file goblin-agent.json is created. This is the configuration file for the agent. Most of the options are only available by editing the file. The agent also supports uploading an image that represents the node. The default name for such image is node.avif. This option is also configurable via the configuration file. Other formats such as jpg, png, and webp are also supported. Keep in mind that the image will be base64 encoded and stored in every measurement report which uses the node. The image feature is completely optional and can be discarded.
Inside the work directory, the plans are stored in subdirectories. Only one level of subdirectories is considered. The default name of the plan description file is measurement.md. This can be changed in the configuration file. The plan does not contain the executable measurement script. There can be multiple scripts and typically such scripts are listed in the plan description and also located in the same subdirectory. The plan also contains a document template for the measurement report. Such documents are formatted using the Markdown syntax. Markdown supports linking to assets such as images. Such images may also be located in the same subdirectory.
Obtaining projects
The plan file along with the other files required by the measurement must be either manually added to the node or downloaded with the agent's download command. The agent can be reconfigured without the need to shut it down. Reconfiguration will browse the subdirectories and search for measurement plan descriptions. The agent can then be queried for available plans.
Measurement plan description
When launching the agent, by default it will browse the subdirectories and attempts to parse all files with the name rootPath/*/measurement.md.
The file has the following structure:
- A YAML metadata block
- Markdown document block
---
METADATA BLOCK
---
DOCUMENT BLOCK
Metadata block
The metadata block uses the YAML syntax:
---
key: value
another-key:
  - value-list item 1
  - value-list item 2
---
The metadata block recognizes the following special fields:
| Field | Description |
|---|---|
| name | The name of the measurement |
| author | The author of the measurement |
| description | The description of the measurement |
| active-channels | Active meter--channel pairs |
| active-resources | Active unit-resource pairs |
| active-nodes | Active nodes participating in the measurement |
| initialization-strategy | Initialization strategy |
| resource-filters | A list of substrings matching the names of resource that should be included |
| report-modes | The names of the modes for the report UI. |
| report-palette | The palette to use for the report UI. |
| visible-sections | Sections visible in different modes. |
| expanded-section | Sections expanded in different modes. |
| plan-id | Unique UUID code of the plan |
| collector | List of nodes + collection settings |
| script | Scripts to be called when measuring |
| runs | Number of runs |
| timeout | Maximum time to run the measurement |
| calibration | Calibration target |
| calibration-threshold | Threshold value for determining calibration targets |
| calibration-delta | Delta value for determining calibration targets |
| units | Units that are potential targets for the calibration |
| exclude-units | Units that should be excluded for calibration |
The following sections describe the possible values for fields.
Generic fields
- name: The name of the measurement
- renames the session, used when enumerating plans, shown in the UI & report
- should not be too long
- API: also available via API
- author: The author of the measurement
- author of the session, used when enumerating plans, shown in the UI & report
- currently only a name, no email address
- API: also available via API
- description: The description of the measurement
- description of the session, used when enumerating plans, shown in the UI & report
- maximum length ~one paragraph
- API: also available via API
- active-channels: Active meter--channel pairs
- format: meter/channel=friendly_name Description that can have spaces
- special meter/channels: RAPL/node-core, RAPL/node-package-0
- the special variable $this can be used as the node name for RAPL meters
- when starting a measurement, affects the selected meters:
- initialization-strategy=IncludeNone
- do not include any channels / nodes
- initialization-strategy=IncludeAllFree
- include all available channels / nodes
- initialization-strategy=IncludeActive
- includes only active channels / nodes, if available
- initialization-strategy=RequireActive
- include the active channels / nodes, fail to initialize if something is missing
- does not consider RAPL meters when initializing
- initialization-strategy=IncludeNone
- in the report view, the total energy readings from active meters/channels are shown by default
- API: No specific endpoints, available via the variables API (import/variables)
- format: meter/channel=friendly_name Description that can have spaces
- active-resources: Active unit-resource pairs
- format: node|unit/resource=friendly_name Description that can have spaces
- the special variables $this and $all can be used as the node name
- TODO: do we convert : to / now?
- API: No specific endpoints, available via the variables API (import/variables)
- active-nodes: Active nodes participating in the measurement
- format: list of node names
- the special variables $this and $all can be used as a node name
- API: No specific endpoints, available via the variables API (import/variables)
- initialization-strategy: Initialization strategy
- specifies meter/node requirements for session initialization
- format: one of
- IncludeNone | IncludeAllFree | IncludeActive | RequireActive
- API: No specific endpoints, available via the variables API (import/variables)
- resource-filters: A list of substrings matching the names of resource that should be included
- format: list of substrings used for matching (union)
- the idea is to filter the resources before logging because some systems produce excessive amounts of resource data
- 'counter' is always needed for RAPL/NVML meters
- API: also available via API
Report related fields
- report-modes: The names of the modes for the report UI.
- report-palette: The palette to use for the report UI.
- visible-sections: Sections visible in different modes. A comma separated list entry should be provided for each mode and the number of modes should match.
- expanded-sections: Sections expanded in different modes. A comma separated list entry should be provided for each mode and the number of modes should match.
Agent related fields
- plan-id: Unique UUID code of the plan
- API: no, the concept is only relevant in the context of agents.
- collector: List of nodes + collection settings
- format: list of collector instructions for agents
- agentId=list,of,collector,flags
- sets up the collector for the 'agentId'. The flags control features such as RAPL
- can configure multiple agents (multiple items)
- the agent id must match the node name
- API: no, the concept is only relevant in the context of agents.
- format: list of collector instructions for agents
- script: scripts to be called when measuring
- format: list of shell command invocations
- each item can contain space separated arguments
- if the first item ends with .sh, it is considered a Bash script and opened with bash
- if the first item ends with .py, it is considered a Python script and opened with python
- other scripts must be started with the interpreter, not directly (a full path to the executable must be provided as the first item)
- the command line will be appended with the extra arguments:
- server host name
- session id
- run id
- the scripts are responsible for starting measurements & runs. The agent takes care of starting and configuring the session, starting the collectd collectors, and synchronizing the time stamps.
- API: no, the concept is only relevant in the context of agents.
- runs: number of runs
- common for all measurements
- can be non-numeric - e.g. comma separated numbers
- measurement script
- API: no, the concept is only relevant in the context of agents.
- timeout: maximum time to run the measurement
- unit: seconds, a long integer
- the same timeout is used for all scripts and the collector
- API: no, the concept is only relevant in the context of agents.
Calibration related fields
The following undocumented fields are used for the calibration task:
- calibration: calibration target
- calibration-threshold: threshold value for determining calibration targets
- calibration-delta: delta value for determining calibration targets
- units: units that are potential targets for the calibration
- exclude-units: units that should be excluded for calibration
Example
---
name: System utility benchmarks
author: Captain Planet
description: Runs CPU benchmarks using the cryptsetup utility.
active-channels:
  - RAPL/sut-package-0=sut_cpu CPU package power via RAPL
  - RAPL/sut-core=sut_core CPU core power via RAPL
active-resources:
  - sut|memory/memory-free=free_ram Free RAM memory
  - sut|memory/memory-used=used_ram Used RAM memory
active-nodes:
  - sut
resource-filters:
  - memory-used
  - memory-free
  - memory-cached
  - memory-buffered
  - if_octets
  - cpu-user
  - cpu-system
  - cpu-idle
  - counter
initialization-strategy:
  - RequireActive
sections:
  - intro
  - another
collector:
  - sut=ACTIVE,HTTP,RAPL
script:
  - algorithm1.sh
  - algorithm2.sh
  - algorithm3.sh
runs: 4
timeout: 600
report-modes:
  - Technical Report
  - High-Level Report
report-palette:
  - #0b84a5
  - #f6c85f
  - #6f4e7c
  - #9b5de5
  - #ff6b6b
  - #3ac569
  - #ffa600
visible-sections:
  - 0,1,2,3,4
  - 0,1
expanded-sections:
  - 0,1,2
  - 0,1
---
Markdown document
The Markdown document is used as a source template for the final measurement report. It also comes with a couple of special features.
The document consists of sections. Each section is separated with a line that only contains --- and nothing else. The sections are associated with an index, starting with 0, 1, 2, ... These indices can be referred to by the special fields visible-sections and expanded-sections.
The Markdown parser supports the following special commands:
[BOXPLOT]: Add a box plot widget[SUMMARYTABLE:boxplot-1]: Add a summary table, associated with the first box plot. Note: the 1 here is the id of the widget. All widgets have an id.[SCATTERPLOT]: Add a scatter plot widget[NODEDATA]: Add a node data widgets for all nodes[NODEDATA:name]: Add a node data widget for node 'name'
The parser also recognizes the following basic Markdown features:
- headings
- tables
- images
- links
- ordered and unordered lists
- text styles: underline, italic, bold, strike-through
Example
This is an example section with the number 0.
This will be shown both in the `Technical Report`
and the `High-Level Report`, expanded.

---
## Summary
This is an example section with the number 1.
This will be shown both in the `Technical Report`
and the `High-Level Report`, expanded.
This is the widget 1, boxplot:
[BOXPLOT]
This is the widget 2, summary table:
[SUMMARYTABLE:boxplot-1]
Summary tables must be always linked with a boxplot
that is visible in the same report mode!
---
## Overview of the runs
This is an example section with the number 2.
This will only be shown in the `Technical Report`
and will be expanded by default!
This is the widget 3, scatter plot:
[SCATTERPLOT]
---
## Nodes used in the measurement
This is an example section with the number 3.
This will only be shown in the `Technical Report`
but will NOT be expanded by default!
This is the widget 4, node data:
[NODEDATA]
---
This is an example section with the number 4.
This will only be shown in the `Technical Report`
but will NOT be expanded by default!
This is the widget 5, node data for the node `sut`:
[NODEDATA:sut]
Next step: Setting up a measurement plan
The API for controlling the agent is described here as well.