Power

Goblin


To better understand the logic behind PowerGoblin's measurement, we will familiarize ourselves with the application's terminology first.
PowerGoblin Service Instance
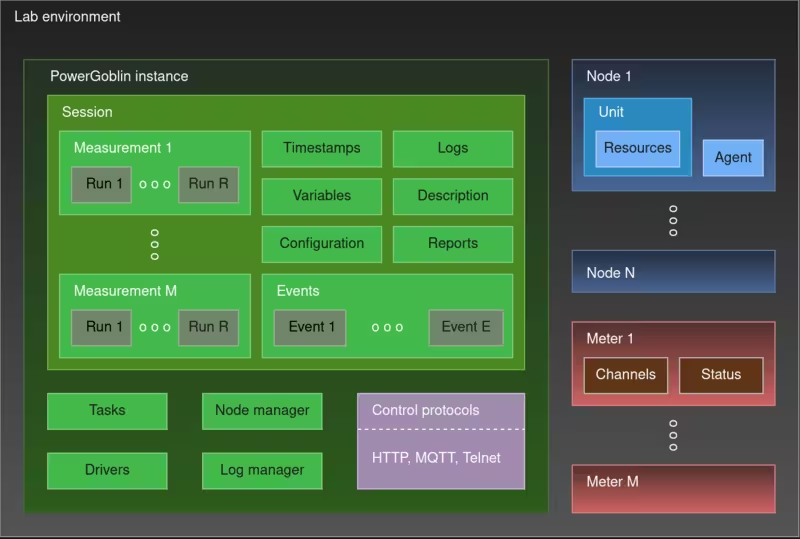
When PowerGoblin is started, a runtime application process, aka PowerGoblin Service Instance, remains operational on the host system. The instance is a server process and is supposed to be controlled via APIs. By default, an HTTP API is exposed. Telnet and MQTT APIs can also be enabled.
The instance is not supposed to be run outside lab environments as it does not provide any kind of access control. It accepts connections from ANY interface available to the process. If you need more fine-grained access control, set up a service level firewall, or wish to limit the memory and CPU consumption of the process, consider setting up a systemd service unit for the instance. For external access, a proxy server can be set up. A preliminary skeleton project for an application level proxy is available in the PowerGoblin repository. Such configuration is currently out of the scope of this manual.
The instance keeps track of the following entities:
- Set of meters (see Meter): free meters not associated with sessions and busy meters reserved by sessions. There are also simulated meters for testing and dummy meters that act as placeholder values for storing the specs of meters associated with previous sessions.
- Set of measurement sessions (see Session): active sessions are stored in memory. Past sessions can be stored on disk and restored upon request. The sessions contain all the measurement data (e.g. events, associated nodes and meters, other variables) required to replay a set of previous measurements for further analysis and reporting.
- Set of registered nodes (see Node) with command queues for coordinating agent-based (see Agent) nodes. The instance also keeps track of the meters associated with nodes and routes the resource data received from the nodes to the sessions. The node specifications from past registrations are cached to provide a better view of the architecture.
- Set of tasks: asynchronous background tasks that can be observed by the clients. Currently, the main uses of background tasks are the generation of session reports and the benchmarks for the PowerGoblin APIs.
It has also the following features:
- Protocol servers for listening to connections from clients
- Node manager for coordinating messaging with the agents
- Log manager for managing the on-disk session logs
- Task manager for managing the asynchronous background tasks
- Global configuration of the instance
- Uptime etc. live data
Session
The measurement session consists of all data related to the measurement arrangement. This makes it possible to maintain concurrent sessions with different meters and measurement, and to store and restore the session for later review without losing any information related to the measurement.
PowerGoblin supports multiple simultaneous sessions. Sessions can be either freshly started with associated meters (see Meter) or previous sessions restored from session dump file on disk. When performing measurements (see Measurement), only the events from the meters associated with the session will be logged. In a similar fashion, a session can define filters for resource events coming from the resource data collectors. These external collectors need to be initialized and guided to route the data back to this specific session.
Since the associated meters may not be available when restoring the session (perhaps on a totally different system), in general it is not possible to fully restore an existing session from disk to its previous state. PowerGoblin solves this by storing a snapshot of the session with so-called dummy meters that only carry the specifications of the original meters. Enough information is stored so that the session can be restored, the placeholder meters merged with the real ones, and the session further extended with new measurements, if needed.
The session contains various data such as the numeric id, the name, the author, and the description of the session, the exact start and stop time (optional), a copy of the instance's configuration (see Configuration), a mapping of meter/channel ids and node/unit ids (see Node) to human-readable names, the specifications and handlers for the meters and all the aggregated meter, resource (see Data sources), and control (trigger) events (see Event) associated with the session. The measurement data is further divided into measurements and runs (see Run).
A session can be open or closed. All session have a start time. In addition, a closed session has a stop time. The general idea is to mark session as closed when all the measurements are done and the session is ready to be stored on disk. Further processing of the session should not alter the data unless explicitly requested. If more measurements need to be done, opening and closing the session again will tag it with a different stop time to make it explicitly distinct from the previous session.
A session can also be busy. That is, currently performing a measurement. Adding and removing meters to/from a busy session is prohibited. Also meters associated with a busy session will not be reconfigured when scanning for new meters.
Ideally a session should not collect any data not relevant to the analysis of the planned measurement. PowerGoblin offers ways to highlight active data sources (meters and resources). In addition, in a system with a multitude of nodesand meters, a measurement can be started with only the meters and resources that have a meaningful role in the measurement.
Meter
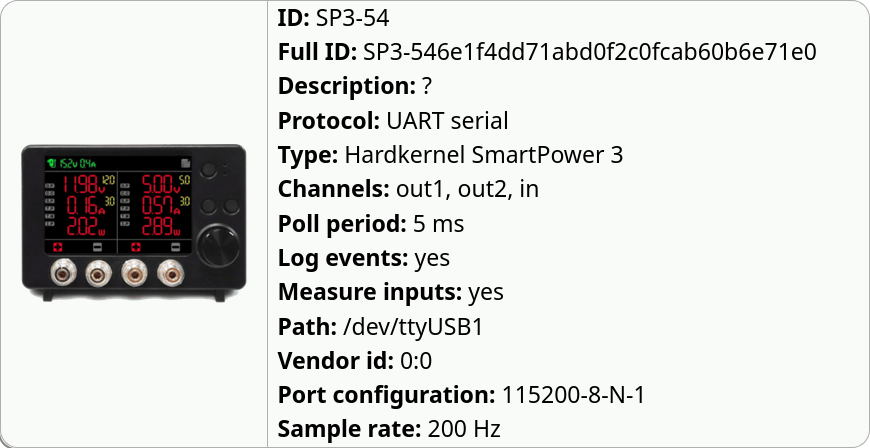
All the meters available on the PowerGoblin instance are either unassigned (assigned to a free pool) or assigned to a single session at a time.
Sessions restored from disk will be assigned dummy meters that cannot produce any readings, but maintain a snapshot copy of the specifications of the original meters that were used in the session before closing, storing, and restoring the session. The snapshot is sufficient for producing reports of the session. In addition, if opened in the original system with all the original meters available, the dummy meters can be merged with the originals in order to further extend the session at a later time.
PowerGoblin also supports simulated meters which are virtual meters useful for the testing of the application. The meters generate random events and the number of available simulated meters can be configured when starting the application or later via the web GUI or the control API.
PowerGoblin also supports another form of virtual meter. The RAPL counters of modern hardware are exposed as resource events. PowerGoblin can detect these data source and convert them to meters to make it easier to compare the power and energy readings of the physical meters to the RAPL generated data.
Event
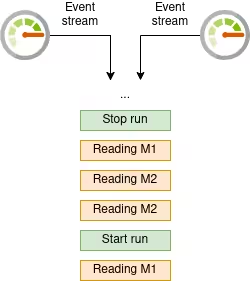
All the meters configured for the PowerGoblin instance will produce meter events. If the meter is unassigned (free), the past events will not be logged. Only the most recent event is used for visualizing the meter's state in the web GUI (the same data is also available via the APIs). After the meter has been assigned to a session, the number of events will be logged. Also, in a busy session, also the past meter readings will be logged to disk. The session maintains the state of the measurement and run so that each event can be positioned chronologically somewhere between the control (trigger) events.
During an active measurement session, PowerGoblin starts logging meter events from the meters assigned to the session. Each meter event either contains a reading associated with the channels of a meter or signals a read error. Currently, if a meter produces multiple points of data (e.g. multiple input/output channels) during a single time step, a distinct event is generated for each channel.
In addition to meter events originating from the meters, there are also resource consumption events originating from the resource collectors (collectd). These are also converted to resource consumption events for further analysis.
The user may wish to further configure the session or measurement (e.g. to rename) to make it easier to later analyze the logged data. Configuring such aspects produces control events. In practice, these events are processed early and the session data updated accordingly so the events don't need to be searched later from the event stream.
In addition, there are control or trigger events. These events can be used for positioning the other events between a small set of meaningful control points, e.g. when a measurement or run starts or stops. There are seven types of trigger events, but the events for starting and stopping runs and measurements are most commonly used in further analysis.
Command
Commands are control artifacts similar to events, but unlike events, the commands will be not stored as part of the session data. For example, trigger events for starting and stopping measurements are events, but a command is used for discarding or storing the session. The commands are supposed to control the PowerGoblin instance and are not relevant for later analysis of the session data.
There is also a separate class of agent commands that form another hierarchy of commands for controlling the agents on nodes. There is a standard command for enqueueing an encapsulated agent command to a specific node's command queue, but this is the only connection between the PowerGoblin instance and PowerGoblin agent commands.
Measurement
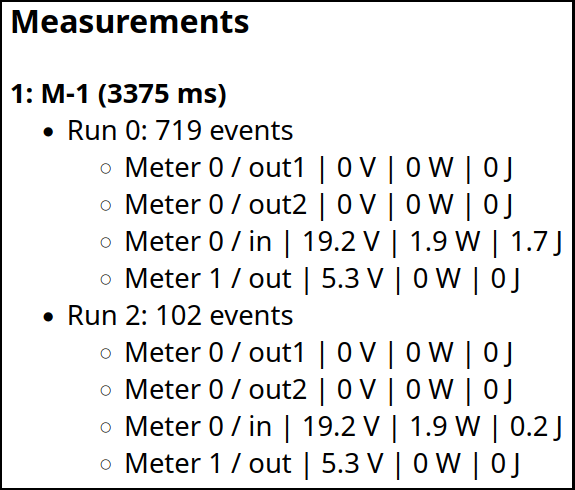
A session consists of measurements. Different measurements represent different tasks. A measurement is identified by a pair of trigger messages for starting and stopping the measurement. E.g. a test setup can measure the power consumption of different sub-pages on a domain. Thus, each sub-page should trigger a separate measurement entity. Another example would be the measurement of different sorting algorithms. Each algorithm or a combination of algorithm and dataset would be a single measurement. In general, distinct measurements model distinct concepts.
The measurements are identified with a name. By default, the measurements are named as M-1, M-2, and so forth. If needed, each measurement can be renamed when it is in the active state, i.e. not stopped. Please note that the events logged before the rename event will be associated with the old name. Measurements cannot be nested, thus only a single measurement can be active at any time.
Run
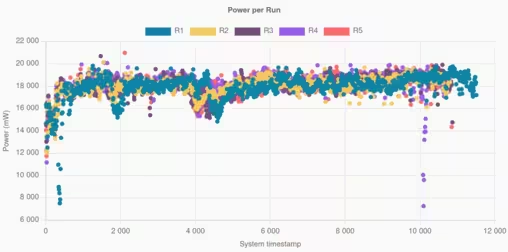
Each measurement consists of zero or more runs. The purpose of the runs is to support statistical analysis by tagging repetitions. Each distinct run in a measurement should perform exactly the same things unless you specifically want the data to also reflect the variations between the runs.
The runs will be identified with positive integers (1, 2, ...). Events will be logged even before the first run starts. This implicit run will have an id of 0. Thus, for measurements with only a single run, a run can be easily distinguished even without explicitly starting a run. Runs cannot be currently nested, thus only a single run can be active at any time.
Node & unit
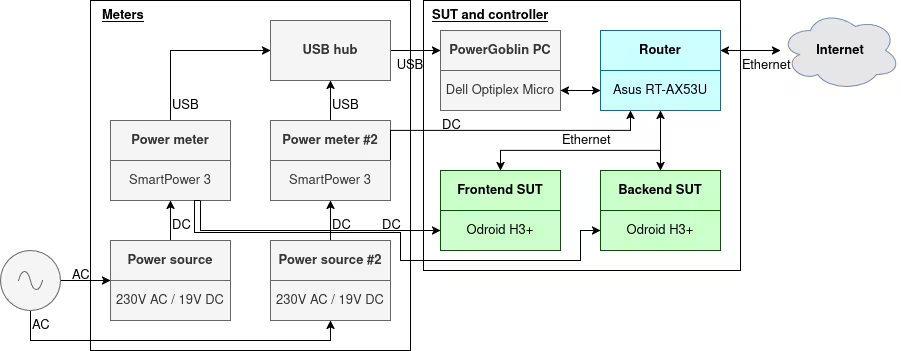
Node is an overloaded, abstract concept. Just like meter reading events are associated with a meter and channel, the resource consumption is associated with a node and unit. The node here represents a device that must contain at least one unit.
When collecting resource data with collect, collect will use the hostname of the system as the name of the node, by default, but this can be overridden. The name of the resource path without the node's name is the unit.
In the context of agents, the node is the system running the agent. The agent can define arbitrary units for the node. Typically, concepts such as 'cpu' or 'network' are being used. When calibrating the meters, the agent and PowerGoblin instance can together detect if a certain type of load increases the consumption in one of the meters. This meter can then be associated with the node + unit pair. The node + unit pair is then used to describe that meter + channel pair. These pairs can also be explicitly described in the measurement plan.
Agent
The agent is a special client software for PowerGoblin that connects to the PowerGoblin instance and works as a "worker" process that periodically queries for new commands in order to execute them sequentially. When launching the agent, the agent registers itself and defines the node it runs on and the associated units available for calibration. All of these definitions are totally arbitrary, but can be used to automate the preparation and execution of a measurement session.
The agents have a set of commands for e.g. downloading measurement plans, executing commands, executing measurements, performing calibrations, collecting resource data etc.
Data sources
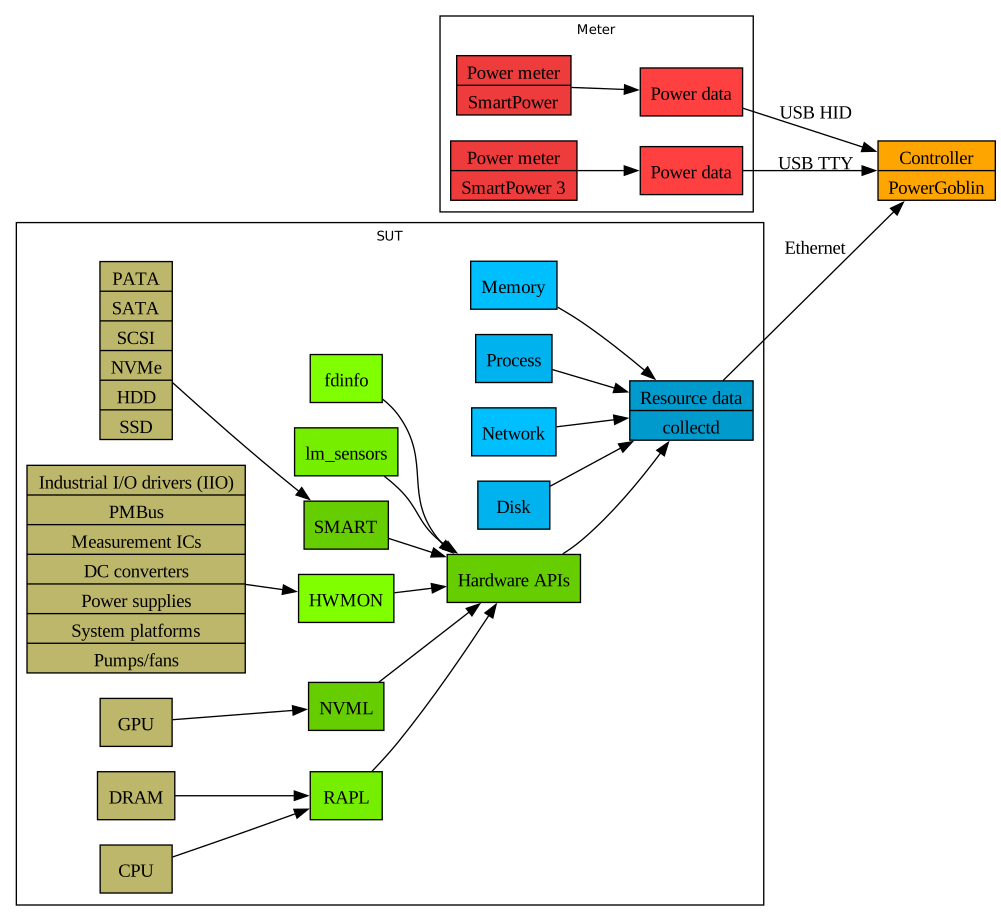
PowerGoblin supports a variety of mechanisms for importing measurement information from different types of data sources. For certain power meters, there is direct driver support in PowerGoblin. This is because these meters do not communicate using any standard protocol and there are no libraries widely available for interfacing with the meters.
On the other hand, PowerGoblin makes use of a tool called collectd for accessing a wide range of different data sources. Collectd is a meta-tool with a plugin architecture, supporting existing standards and driver interfaces. For examples, the CPU load, memory usage, network and disk operation throughput etc. can be monitored via the operating system's standard interfaces. Power and energy measurement (e.g. CPU, DRAM memory modules, and GPUs) can also be performed with the help of 3rd party plugins. The data collection process is discussed here in more detail.
Software based power measurements can be performed with devices utilizing different interfaces supported by collectd or 3rd party collectd plugins.