


- Scope and objectives
- Measurement process
- Setup
- Performing the measurement
- Analyzing the results
- External links
This project documents and implements a procedure for performing hardware based power/energy measurement of the front-end machine in a full-stack web application (see this example for a measurement setup for the back-end).
Hardware based here means that we have a dedicated measurement hardware for measuring the accumulated total consumption.
While power consumption quite likely correlates with the efficiency of the code (in terms of computational performance) and its execution speed, it is a distinct concept -- especially in the age of multicore processors. In practice, the consumption metrics in general cannot be derived from these other properties.
Scope and objectives
Full-stack applications typically consist of a front-end and a back-end. One exception is single page applications (SPA), which can in principle run entirely in the browser. In addition to these, traditional web pages typically also include both a front-end and a back-end, but the processing in the front-end may be limited to just rendering the page document without executing any application code.
The measurement will determine the amount of power consumed by the front-end, without including the back-end's consumption. The measurement typically does not include any use of the web application that does not involve a browser and human user (API calls invoked by other applications, IoT).
Typical focus points of measurements are the consumption of a page load, one or more functions calls, or some use case coordinated by a script. When measuring larger scenarios, we may want to measure the entire user session, including the launching of the browser, navigating to the site and the closing of the browser.
There is a significant and growing number of full-stack software deployment models and implementation technologies. Going through them here is too laborious and would require constant maintenance, which places such a survey outside the scope of our example. Instead, the goal is to demonstrate the process of augmenting an existing project implemented in Java & Quarkus with the code required for doing a measurement.
The implementation covered in this example demonstrates the measurement of front-end code with two main approaches: measurement of the page load in a simulated Selenium session, and measurement of resource artifacts exposed as variables in the page's JavaScript code. Both measurements are initiated by a Selenium script.
Measurement process
We study the structure of the measurement process in this section. This is a typical measurement performed by an automated testing script. It has the following important properties which basically makes it suitable as a basis for scientific research:
- Fully documented process
- Reproducible procedure
- Open data
- Generated results usable for quantitative research
The whole measurement session can be fully automated if needed. Our example uses a hybrid approach where the user is still needed to initiate the measurement process, but the actual measurement runs are done automatically. Tools can greatly help when aggregating the result data, especially when performing a large number of measurements.
High level description
On high level we identify the following units required for this measurement: PC (controller PC, PowerGoblin instance), SUT-Back (executes the back-end service), and SUT-Front (executes the measurement script).
We perform the following tasks in a sequence:
| Unit | Task |
|---|---|
| All | Set up the hardware and software |
| PC | Launch PowerGoblin |
| SUT-Back | Launch the back-end service |
| SUT-Front | Launch the measurement script |
| - | Wait for the measurement to finish.. |
| PC | Analyze the logs & plots |
The measurement session is fully deterministic without exceptions. The first three phases are not time-critical, and they are performed manually. The execution of the measurement script is automatic.
Measurement script
The following operational structure is extracted from the test-frontend.sh script:
- MSG: start measurement session (line 11)
- MSG: upload the template for a measurement report and rename it (lines 12-13)
- Start the Selenium library and advice it to connect to PowerGoblin (line 15)
- MSG: start the "Selenium" measurement and rename it (lines 17-18)
- for run in {
1, ...,10}- MSG: start run (line 21)
- perform a page request
http://sut-back/page - read the register the resource variables 'banana' and 'strawberry' (lines 24-25)
- MSG: stop run (line 26)
- MSG: stop the measurement (line 28)
- Close the Selenium library (line 30)
- MSG: close the measurement session (lines 32-33)
In this abstract description, the messages are sent over HTTP/JSON, as PowerGoblin provides REST like endpoints for such messages. The terminology used by PowerGoblin is explained in the usage section of its manual.
Setup
Hardware setup
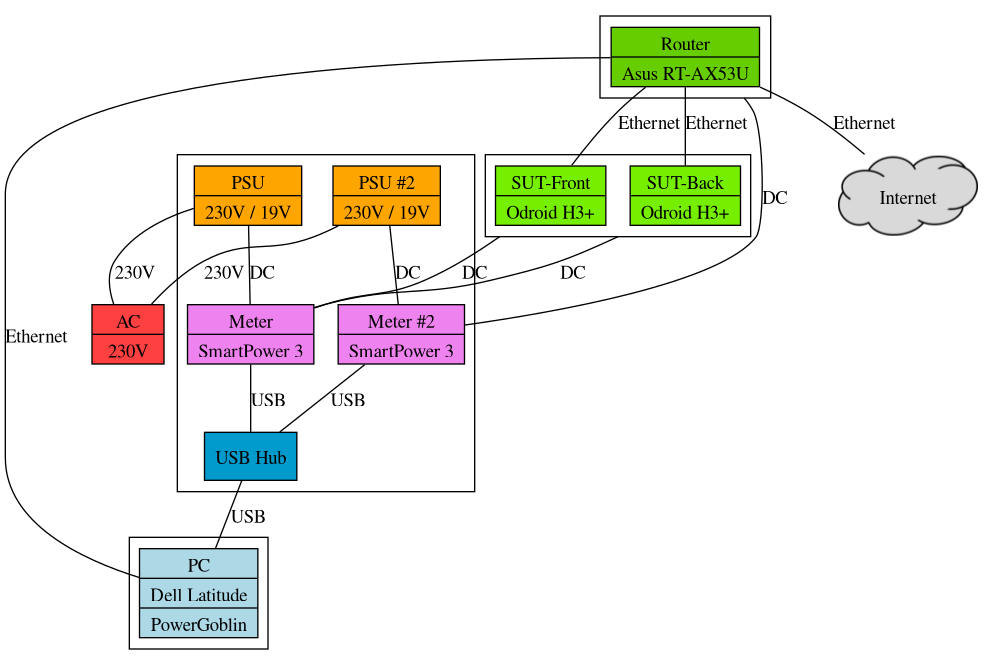
The hardware configuration diagram for this demonstration is presented here.
The graph is divided into four clusters, starting from the left:
- PC (controller, PowerGoblin instance)
- Power meters (Meter, Meter #2, PSUs, USB Hub)
- SUT-Front (front-end system under test)
- SUT-Back (back-end system under test)
- Network router
Relevant hardware interfaces are indicated by the labeled edges in the graph. All the power meters are connected to the controller PC via USB, all the SUT and network devices are connected to the power meters with DC cables, and all the SUT, network, and controller devices also communicate using the ethernet network provided by the network router.
Although this hardware configuration enables the power measurement of both the front-end and the back-end, in this example we focus on the measurement of the back-end devices and software.
Software setup
On the devices we use the following software setup:
- Controller PC: PowerGoblin + Arch Linux (any supported operating system should work)
- SUT-Front: Arch Linux (any PC compatible operating system should work)
- SUT-Back: Arch Linux (any PC compatible operating system should work)
- Router: OpenWRT (official factory firmware should also work)
- Meter: latest official firmware
Controller PC
See the PowerGoblin's documentation on downloading and deploying the software. In this example we download the "fat" jar distribution, which should work on any platform:
$ wget https://tech.utugit.fi/soft/tools/power/powergoblin/powergoblin.jar
The file can be downloaded with any browser as well.
In addition, a Java distribution is required on the machine. The manual describes this as well.
SUT-Back
We have installed Arch Linux using archinstall.
We use the following configuration for the installer:
- Locales: us / en_US / UTF-8
- Disk configuration: best effort default / ext4 or btrfs
- Swap: on zram
- Bootloader: systemd-boot
- Hostname: sut-back
- Audio: no
- Profile: Minimal (others will install unnecessary software and require a lot more disk space.)
We also need to install the following extra software:
openssh: for connecting from the controller PCdocker: for setting up the server application with containers
$ pacman -Suy
$ sudo pacman -S docker openssh
Enable ssh to make the machine accessible over the network and Docker to set up containers:
$ sudo systemctl --now enable sshd docker
Reboot.
The back-end service for this example is provided as a source package. Building the back-end requires curl, tar, OpenJDK 21+, Apache Maven, and Docker:
$ sudo pacman -S jdk-openjdk curl tar maven
The example can be built by invoking the following commands:
$ curl https://tech.utugit.fi/soft/tools/power/doc/fullstack-example.tar.gz | tar xfzv -
$ cd fullstack-example
$ mvn package
$ docker build . -t fullstack-example
At this point we have a Docker image available for deploying the Docker container(s) for the back-end service(s). Other third party services could be deployed in a similar fashion. The Docker and Docker Compose tutorials provide starting points for building a service with Docker technologies.
SUT-Front
We have installed Arch Linux using archinstall.
We use the following configuration for the installer:
- Locales: us / en_US / UTF-8
- Disk configuration: best effort default / ext4 or btrfs
- Swap: on zram
- Bootloader: systemd-boot
- Hostname: sut-front
- Audio: no
- Profile: Desktop (a desktop environment is required to run Selenium)
- Desktop: Gnome (unless you know what you're doing)
- Login manager / greeter: GDM
We use the following software on the system:
openssh: for connecting from the controller PCyay: installation of AUR packagesgo: installation of AUR packages (installed by yay)python: measurement scriptspython-requests: measurement scriptspython-dotenv: measurement scriptspython-selenium: measurement scriptspython-webdriver-manager: measurement scriptsselenium-manager: measurement scriptsscreen: background session
First, we need the yay utility to install AUR packages:
$ sudo pacman -Suy
$ wget https://aur.archlinux.org/cgit/aur.git/snapshot/yay.tar.gz
$ tar xf yay.tar.gz
$ cd yay
$ makepkg -s
$ makepkg -i
Next, we'll install some extra packages
$ sudo pacman -S openssh python python-requests python-dotenv screen
$ yay -S python-selenium python-webdriver-manager selenium-manager
Enable ssh to make the machine accessible over the network:
$ sudo systemctl --now enable sshd
From the example distribution, we will only use the Python scripts. The scripts can be extracted by invoking the following commands:
$ cd /
$ curl https://tech.utugit.fi/soft/tools/power/doc/fullstack-example.tar.gz | tar xfzv -
$ cd fullstack-example
The extracted test-frontend.py script will be started in the next step.
Router
Standard OpenWRT installation should work with default settings. The default settings will set up a bridge, NAT, DHCP, DNS, and firewall. The machines should be connected to the LAN ports. The OpenWRT's web interface can be used for discovering the IP addresses of the devices.
Meter
The PowerGoblin manual explain the process of updating the power meter's firmware.
Performing the measurement
Discovering the IP addresses
First, go to the router's web user interface (e.g. 192.168.1.1 should be the OpenWRT's default setting). If you cannot locate this page, find out the PC's IP address and try another one where the fourth octet (number) is 1. The page should list the addresses of the controller PC and the SUT if both are connected.
In this example we assume the following assignment of addresses:
| Device | Host name | IP address | Service port |
|---|---|---|---|
| Router | router | 192.168.1.1 | - |
| Controller | controller | 192.168.1.10 | 8888 |
| SUT-Front | sut-front | 192.168.1.20 | - |
| SUT-Back | sut-back | 192.168.1.30 | 8080 |
Launching PowerGoblin
On the PC, we assume that the PowerGoblin has been installed in the current working directory and Java has also been installed. You can start the application by running:
$ java -jar powergoblin.jar httpPort=8888 -cors
When launching the application, it should display the IP addresses it is listening to, e.g.
Web [Simple HTTP @ 8888] listening at [ http://172.18.0.1:8888 ]
Web [Simple HTTP @ 8888] listening at [ http://172.17.0.1:8888 ]
Web [Simple HTTP @ 8888] listening at [ http://192.168.1.10:8888 ]
Here http://192.168.1.10:8888 is the address we are going to use later. We use the service port 8888 instead of the default, 8080, to avoid service conflicts in configurations where the back-end service runs on the same machine.
Launching the back-end service
Assuming the Docker image for the back-end service has been build or pulled on the SUT-Back, we can run:
$ docker run -e POWERGOBLIN=controller:8888 --network host fullstack-example:latest
The back-end service does not need any further configuration and is now ready for doing measurements.
Launching the measurement script
When measuring the front-end, there are multiple possible configurations for setting up the measurement. We want to simulate a normal interaction by a client, which requires an external, simulated script on the front-end machine. Normal interaction also requires using a browser instance for accessing the service. We use Selenium for simulating this interaction. The software measurement scripts in the MitViDi project folder contain various examples of using Selenium for measurements.
The external measurement script looks like this:
#!/bin/python

from powergoblin import PowerGoblin
from seleniumdriver import SeleniumDriver
import time
import os

pg = PowerGoblin(os.getenv('POWERGOBLIN'))
web = os.getenv('BACKEND')

pg.get("cmd/startSession")
pg.post_file("session/latest/import/template", "README.md")
pg.get("session/latest/rename/Fullstack%20example%20-%20Frontend")

selenium = SeleniumDriver(powergoblin=pg)

pg.get("session/latest/measurement/start")
pg.get("session/latest/measurement/rename/Selenium")

for i in range(10):
    pg.get("session/latest/run/start")
    selenium.driver.get(f"http://{web}/page")
    # these resources are configured in src/main/resources/org/acme/ipsum.html
    selenium.inject_command("session/latest/resource/banana/add/\"+banana+\"/browser")
    selenium.inject_command("session/latest/resource/strawberry/add/\"+strawberry+\"/browser")
    pg.get("session/latest/run/stop")

pg.get("session/latest/measurement/stop")

selenium.close()

pg.get("session/latest/close")
pg.get("session/latest/remove")
The addresses of the other services are provided to the script via environment variables BACKEND and POWERGOBLIN.
There are now several options to start the measurement:
- Run the Selenium script directly on the machine by logging in locally.
- Connect to the front-end machine via SSH (forwarded X session) and run the Selenium script.
- Connect to the front-end machine via SSH , launch the screen and run the Selenium script in a virtual X-session.
- Run the Selenium script as a systemd system service or in a Docker container as a service launched by the service at boot time of the device.
Approach 1: Local user
One can run the Selenium script directly on the machine by logging in locally. In this case, Selenium uses the SUT's display adapter to draw the windows. This is the easiest approach.
The approach requires plugging in a keyboard and screen. We can prepare things so that e.g. the user only needs to type 'abc' + Enter three times (user id, password, script) to initiate the script. The monitor might also be optional, depending on the hardware.
login: abc
password: abc
$ export BACKEND=sut-back:8080
$ export POWERGOBLIN=controller:8888
$ python test-frontend.py
Approach 2: SSH + X forwarding
One can connect to the machine via SSH (forwarded X session) and run the Selenium script. The downside of this option is that the rendered desktop is passed over the network and this causes overhead on both the front-end machine and network devices. The approach works with headless devices.
$ ssh -X user@sut-front
$ export BACKEND=sut-back:8080
$ export POWERGOBLIN=controller:8888
$ python test-frontend.py
Approach 3: SSH + Screen + Virtual X session
One can SSH to the machine, launch the screen and run the Selenium script in a virtual X-session (requires the 'dwm' window manager here)
$ ssh user@sut-front
$ screen
$ xvfb-run --server-num 9 --server-args="-screen 0 1024x768x24" dwm
$ export BACKEND=sut-back:8080
$ export POWERGOBLIN=controller:8888
$ DISPLAY=:9 python test-frontend.py
To avoid extra network traffic, one can type ctrl-a, d, ctrl-d after starting the script. This could be combined with a small delay in the beginning of the script.
Approach 4: System service
One can also set up a system script to launch the Selenium script. The easiest way is to start a full desktop session with auto-login. For example, lightdm and gdm support auto-login. The Selenium script can be configured to launch on start-up on both X11 and Wayland sessions.
Setting up autologin is described here for lightdm and here for gdm. Launching applications at desktop start-up is described here.
The launch script only needs to launch the Selenium script:
$ export BACKEND=sut-back:8080
$ export POWERGOBLIN=controller:8888
$ python test-frontend.py
We didn't include the full code listings for this approach, because we find it more practical to initiate the front-end benchmarks manually.
Analyzing the results
The PowerGoblin UI (available at http://192.168.1.10:8888 in our setup) contains visualizations and listings for preliminary analysis in the 'Measure' tab (on the top, third from the left). The resulting measurement logs ('Logs' tab) are stored in the logs folder and can also be downloaded via the UI.
Further analysis can be performed by analyzing the measurement logs with the help of analysis tools like Python / R.
External links
- Project repository in UTU GitLab: https://gitlab.utu.fi/tech/soft/mitvidi/software-measurement