


- Scope and objectives
- Measurement process
- Setup
- Performing the measurement
- Analyzing the results
- Manual testing of the algorithms
- External links
This project documents and implements a procedure for performing hardware based power/energy measurement of sorting algorithms.
Hardware based here means that we have a dedicated measurement hardware for measuring the accumulated total consumption.
While power consumption quite likely correlates with the efficiency of the code (in terms of computational performance) and its execution speed, it is a distinct concept -- especially in the age of multicore processors. In practice, the consumption metrics in general cannot be derived from these other properties.
Scope and objectives
This project has two main goals
- Demonstrate how to perform energy measurements by executing prebuilt applications and datasets available in this repository
- prebuilt sorting algorithms: bubble, merge & standard (C++) sort
- prebuild datasets: CSV files with 500, 1 000, 2 000, 2 500, ... 1 000 000 numbers
- baseline measurement for calculating the idle consumption
- Demonstrate the capabilities of the university's lab setup (more complete configuration in the project repository)
- power meters
- headless single board computers
- controller PC + KVM
- network routers and switches
- installed software: PowerGoblin, Linux, OpenWRT
- The measured results can be used to validate the theoretical complexity classes of the sorting algorithms. We do not attempt to derive such properties from the empirical data. We also limit the measurement process to the predefined set of algorithms and datasets.
Measurement process
We study the structure of the measurement process in this section. This is a typical measurement performed by an automated testing script. It has the following important properties which basically makes it suitable as a basis for scientific research:
- Fully documented process
- Reproducible procedure
- Open data
- Generated results usable for quantitative research
The whole measurement session can be fully automated if needed. Our example uses a hybrid approach where the user is still needed to initiate the measurement process, but the actual measurement runs are done automatically. Tools can greatly help when aggregating the result data, especially when performing a large number of measurements.
High level description
On high level we identify the following units required for this measurement: PC (controller PC, PowerGoblin instance), SUT (executes the algorithms and measurement scripts).
We perform the following tasks in a sequence:
| Unit | Task |
|---|---|
| All | Set up the hardware and software |
| PC | Launch PowerGoblin |
| PC | Connect to the SUT with SSH |
| SUT | Launch the measurement script (via SSH) |
| - | Wait for the measurement to finish.. |
| PC | Analyze the logs & plots |
The measurement session is fully deterministic without exceptions. The first three phases are not time-critical, and they are performed manually. The execution of the measurement script is automatic.
Measurement script
The following operational structure is extracted from the sorttest.sh script:
- MSG: start measurement session (line 13)
- MSG: upload the template for a measurement report (line 14)
- for
algoin {bubble,merge,std} (see algorithms)- for
datasetin {data500, ...,data20000} (see datasets)- MSG: start measurement (line 20)
- MSG: rename measurement to
algo-dataset(line 21) - for run in {
1,2,3}- MSG: start run (line 24)
- run
algowithdataset - MSG: stop run (line 27)
- MSG: stop the measurement (line 30)
- for
- MSG: start a baseline measurement for calibration (line 35)
- MSG: rename the measurement (line 36)
- MSG: stop the baseline measurement (line 38)
- MSG: close the measurement session (line 40)
In this abstract description, the messages are sent over HTTP/JSON, as PowerGoblin provides REST like endpoints for such messages. The terminology used by PowerGoblin is explained in the usage section of its manual.
Setup
Hardware setup
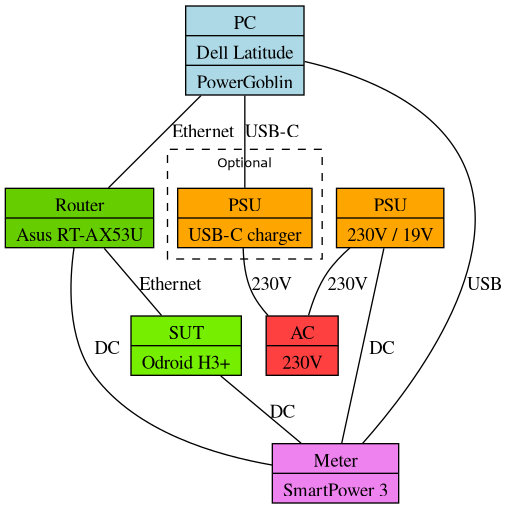
The hardware configuration diagram for this demonstration is presented here.
The graph is divided into four clusters, starting from the left:
- Power meter
- Controller PC (PSU is only required if the battery life is shorter than the duration of the measurement session)
- SUT (system under test)
- Network router
Relevant hardware interfaces are indicated by the labeled edges in the graph.
Software setup
On the devices we use the following software setup:
- Controller PC: PowerGoblin + Arch Linux (any supported operating system should work)
- SUT: Arch Linux (any PC compatible operating system should work)
- Router: OpenWRT (official factory firmware should also work)
- Meter: latest official firmware
Controller PC
See the PowerGoblin's documentation on downloading and deploying the software. In this example we download the "fat" jar distribution, which should work on any platform:
$ wget https://tech.utugit.fi/soft/tools/power/powergoblin/powergoblin.jar
The file can be downloaded with any browser as well.
In addition, a Java distribution is required on the machine. The manual describes this as well.
SUT
We have installed Arch Linux using archinstall. We use the following software on the system:
systemd: init systemsystemd-boot: bootloaderopenssh: for connecting from the controller PCgcc: for building the demo if neededmake: for building the demo if neededgit: for building the demo if neededcurl: API calls in the measurement script
First, install the extra software:
$ sudo pacman -Suy
$ sudo pacman -S gcc make git curl openssh
Enable ssh to make the machine accessible over the network:
$ sudo systemctl --now enable sshd
Since the machine is behind a firewall, using some simple root password should be ok (e.g. root).
The demo has been automatically packaged by the CI script to: https://tech.utugit.fi/education/green/sortdemo/demo.tar.gz
This package can be downloaded on the SUT machine:
$ curl https://tech.utugit.fi/education/green/sortdemo/demo.tar.gz | tar xfzv -
$ cd demo
Router
Standard OpenWRT installation should work with default settings. The default settings will set up a bridge, NAT, DHCP, DNS, and firewall. The machines should be connected to the LAN ports. The OpenWRT's web interface can be used for discovering the IP addresses of the devices.
Meter
The PowerGoblin manual explain the process of updating the power meter's firmware.
Performing the measurement
Discovering the IP addresses
First, go to the router's web user interface (e.g. 192.168.1.1 should be the OpenWRT's default setting). If you cannot locate this page, find out the PC's IP address and try another one where the fourth number is 1. The page should list the addresses of the controller PC and the SUT if both are connected.
Launching PowerGoblin
On the PC, we assume that the PowerGoblin has been installed in the current working directory and Java has also been installed. You can start the application by running:
$ java -jar powergoblin.jar
When launching the application, it should display the IP addresses it is listening to, e.g.
Web [Simple HTTP @ 8080] listening at [ http://172.18.0.1:8080 ]
Web [Simple HTTP @ 8080] listening at [ http://172.17.0.1:8080 ]
Web [Simple HTTP @ 8080] listening at [ http://192.168.1.10:8080 ]
Here http://192.168.1.10:8080 is the address we are going to use later.
Launching the measurement script
We assume the address of the SUT is 192.168.1.20. Let's connect to the SUT first
$ ssh root@192.168.1.20
The demo application uses HTTP for communication. We assume the address and port of the PowerGoblin instance is 192.168.1.10:8080. The following command should start the script:
$ cd demo
$ src/sorttest.sh 192.168.1.10
In order to use some other port, the script needs to be modified.
The measurement script will automatically generate a measurement for each algorithm + dataset combo and do 3 test runs (number of runs is hard-coded in the script). This measurement is fully automatic.
Analyzing the results
The PowerGoblin UI (available at http://192.168.1.10:8080 in our setup) contains visualizations and listings for preliminary analysis in the 'Measure' tab (on the top, third from the left). The resulting measurement logs ('Logs' tab) are stored in the logs folder and can also be downloaded via the UI.
Further analysis can be performed by analyzing the measurement logs with the help of analysis tools like Python / R.
Manual testing of the algorithms
The demo package contains pre-built binaries and pre-processed datasets. You can simply launch any of the binaries and use any of the dataset files as its parameter to initiate the sorting procedure. Example:
$ bin/bubbleSort data/data500.csv
Algorithms
The list of valid sorting algorithms is:
Datasets
For experimenting with manual measurements, the list of valid CSV encoded datasets is:
- data/data500.csv
- data/data1000.csv
- data/data2000.csv
- data/data2500.csv
- data/data5000.csv
- data/data10000.csv
- data/data20000.csv
- data/data25000.csv
- data/data50000.csv
- data/data100000.csv
- data/data200000.csv
- data/data250000.csv
- data/data500000.csv
- data/data1000000.csv
External links
- Project repository in UTU GitLab: https://gitlab.utu.fi/tech/education/green/sortdemo