Power

Goblin




Resource data
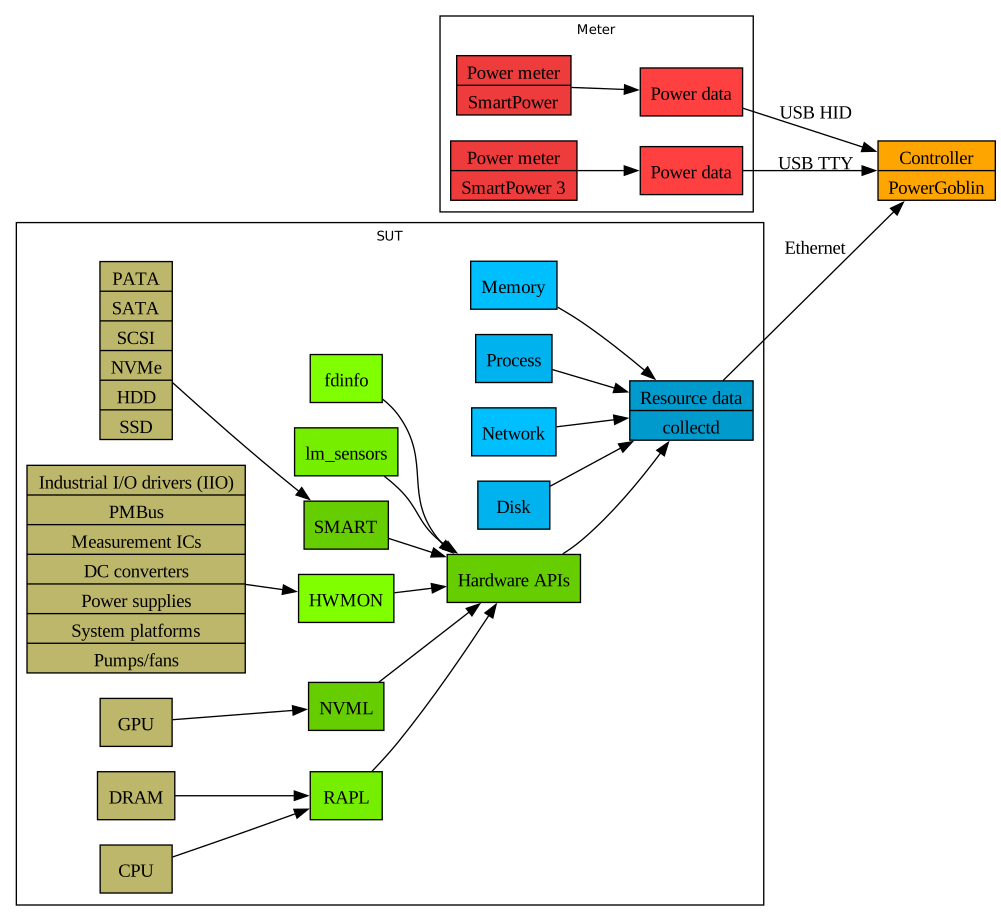
Modern computer systems produce and support the collection of a variety of different resource data. Some of the data is generated by the hardware units, and the role of the operating system is to provide interfaces for reading the hardware registers and counters, and drivers for communicating with the external units. Another source of resource data is the operating system itself. For example, high level abstractions such as the virtual memory system, virtual file systems, process scheduling etc. produce statistics for estimating the system load and process accounting.
Tool: collectd
The collectd tool exposes software-based meter interfaces for the monitoring of resource usage. Collectd is extensible thanks to its plugin framework and a large collection of integrated and third party plugins. Collectd also has a low footprint in terms of resource consumption. These features make it a comprehensive tool for data collection. These are also the reason why collectd is being used as a data collection background process by PowerGoblin.
Operating modes
The advantage of physical power meters is that they be placed outside the system under test to minimize or to totally eliminate possible interference. Unfortunately, resource collection is practically always done on the same system, and thus will also increase the resource and energy consumption.
One way to minimize the impact of resource collection is to use lightweight (native language) tools with low memory footprint and computational load. On Linux / Unix systems, command line tools written in C typically have these properties. Another mitigation is to minimize the amount of collected data. For example, if the system under test does not produce any network traffic, monitoring of the network interfaces can be omitted altogether or be limited to interfaces involved with the process. Same applies to disks and other resource types as well.
In addition to data collection, the logging of collected data also consumes resources. The collected data also needs to be either stored in memory, on disk, or transmitted over the network for archiving. PowerGoblin provides two operating modes for data collection with different tradeoffs.
Resource data dumps: The data dump approach is based on the assumption that network traffic is more costly in terms of resource usage than local storage (hard drives). In addition, RAM based virtual disks have even lower overhead compared to disks. Collectd supports using local storage for the measurement logs (csv plugin). On Linux, the storage can be a physical or a tmpfs-based virtual drive. It could even be a remote network filesystem such as NFS or NBD.
PowerGoblin supports this workflow by having a predefined configuration for collectd. After the measurement, the disk-based dump file can be submitted for late processing, and PowerGoblin has logic for adjusting the timestamps of resource events. After the measurement is done, the collectd data is compiled into a dump file (zip package) that is sent over the network to the PowerGoblin instance with an HTTP POST request.
The largest downside of the data dump approach is that the system can run out of memory especially with longer sessions. In such cases, installing more RAM or storing the logs to disk are two proposed solutions. Switching to a disk based logging is easy since we only need to specify a different target directory that is not a tmpfs mount point. Another minor issue is that in this mode, real-time resource data is not available for a dashboard view.
Resource data streaming: Collectd also supports the streaming of resource data via sockets. In this mode, PowerGoblin acts as a sink for the HTTP protocol (http plugin). Obviously, in this mode more data is being transferred via the network interface. As an advantage, the capacity of log storage is only limited by the available disk space on the system running the PowerGoblin service. This is especially important when measuring low-end systems. Real-time dashboard view of the data can be provided, also when the system is not participating in any measurements.
Other challenges
Another challenge when logging data from remote systems (when SUT is distinct from the PowerGoblin service instance) is that the system clocks might not be synchronized or even run at different speed. PowerGoblin provides a functionality for synchronizing the timestamps and interpolating between synchronization points, but currently this functionality is not very precise. Currently, it is recommended to run ntpd or some other time synchronization service on all systems.
API endpoints
The resource related APIs are available via the following PowerGoblin service API endpoints:
| Method | Endpoint | Description | Context |
|---|---|---|---|
| POST | /api/v2/node/:node/collectd-stream | Receive a collectd resource stream (http plugin). Payload: resource stream | unit 'node' |
| POST | /api/v2/null | A null sink that discards everything (network benchmarks). Payload: stream | global |
| POST | /api/v2/session/:session/import/collectd-stream/:unit | Receive a collectd resource stream (http plugin), 'unit' override is optional. Payload: resource stream | instance 'instance', unit 'unit' |
| POST | /api/v2/session/:session/import/collectd/:unit | Import collectd dump (zip archive), 'unit' override is optional. Payload: resource dump (zip) | instance 'instance', unit 'unit' |
| GET | /api/v2/session/:session/resource | Return the session resource consumption. | session 'session' |
| POST | /api/v2/session/:session/resource/add/:unit/:resource | Add a custom resource entry for unit/resource. Payload: numeric resource value | instance 'instance' |
| POST | /api/v2/session/:session/resource/exclude | Exclude the resource filter(s). Payload: comma separated list of filters | instance 'instance' |
| POST | /api/v2/session/:session/resource/include | Include the resource filter(s). Payload: comma separated list of filters | instance 'instance' |
Filtering
The output of collectd should be primarily controlled from the collectd configuration file. Some plugins do not offer any kind of fine-grained way to filtering the logged data. PowerGoblin defines an internal filter for selecting only the relevant data for further processing.

The filter is inclusive, i.e. only the data that has been explicitly listed will be included. Each filter entry performs a simple substring match and the end result is the union of all filters. E.g. if_octets includes
mypc/interface-lo/if_octets-2024-11-11andmypc/interface-lan/if_octets-2024-11-11and evenmypc/interface-lan/if_octets_foobar-2024-11-11, but most likely no such file is created by the plugins.
When adding new plugins to the configuration, remember to also adjust the filter!
Filter configurations
The global default filter is defined by the resourceFilters field in the global configuration file. It is a comma-separated list of filters:
"memory-used", "memory-free", "memory-cached", "memory-buffered",
"if_octets", "disk_octets", "cpu-0-cpu-user", "cpu-0-cpu-system",
"cpu-0-cpu-idle", "counter"
The global default filter is used for new sessions. If a measurement plan description defines a non-empty set of filters, those are used instead.
In addition, the API can be used to include / exclude filters. For instance, the following API call will include the filter 'counter', which matches the RAPL counters. This is usually enabled by default.
echo counter|pg_post session/latest/resource/include
Measurement plan description: When using agents and measurement plans, the collection is performed automatically. A declarative description of the collection process is sufficient. Collectd must be available on the nodes and support the required flags. The measurement plan contains several fields for controlling the logging of resource events:
- active-resources: custom names/descriptions for resources
- active-nodes: nodes participating in the collection need to be listed
- resource-filters: list of resource filters
- collector: list of nodes participating in the collection with collection flags
Manual setup: The following configuration file (e.g. collectd.conf, does not require any specific path) sets up collectd to collect data on the variables that PowerGoblin analyzes using the default configuration shown above:
Interval 0.1

LoadPlugin cpu
LoadPlugin csv
LoadPlugin interface
LoadPlugin load
LoadPlugin memory

<Plugin csv>
  DataDir "/tmp/collectd"
  StoreRates false
</Plugin>
The configuration is now ready, and we can continue using collectd.
Plugins
Each collectd plugin requires a unique configuration section in the collectd configuration file, if the default configuration is considered inadequate. Some examples are presented here:
- RAPL: processor and DRAM energy / power
- NVML: GPU power
- HWMON
- Measurement ICs
- ina*, ltc*, max*, adm*, isl*
- lm25066, lochnagar, pli1209bc, stpddc60
- pmbus
- DC converters
- ir*
- lineage-pem, pxe1610, tps53679, ucd9000, ucd9200
- Power supplies
- acbel-fsg032
- bel-pfe, bpa-rs600,
- corsair-psu, crps, dps920ab
- ibm-cffps, inspur-ipsps1, lineage-pem, twl4030-madc-hwmon
- System platforms
- hp-wmi-sensors
- ibmpowernv
- intel-m10-bmc-hwmon
- occ-hwmon
- sbrmi
- xgene-hwmon
- pump/fan
- aquacomputer_d5next
- Measurement ICs
RAPL
Machines with the RAPL (Running Average Power Limit) feature provide internal support for power / energy measurement. Recent Intel & AMD CPUs provide machine registers for RAPL. Support for RAPL was also added to Linux 3.10 in 2013, and exposed later via the powercap framework (kernel API). Depending on the hardware generation, RAPL provides energy estimations for the following units:
- The whole package (
package-0) - The cores (
core) - The non-core parts of the SoC package (client processors,
uncore) - The DRAM (server processors,
dram) - System (
psys)
From the hardware perspective, the supported CPU generations are:
| Generation | Model name | Support |
|---|---|---|
| Intel | ||
| 1st Gen Core | Nehalem / Westmere | No, no RAPL MSRs |
| 2nd Gen Core | Sandy Bridge (EP) | Yes, first RAPL implementation |
| 3rd Gen Core | Ivy Bridge (EP) | Yes, expanded support |
| 4th Gen Core | Haswell (EP) | Yes, better DRAM support |
| 5th Gen Core | Broadwell (EP) | Yes, continued |
| 6th Gen Core | Skylake (EP) | Yes, added PSys domain on some SKUs |
| 7th Gen+ Core | Kaby Lake+ | Yes, fully supported |
| AMD | ||
| Bulldozer / Piledriver / Excavator | FX/APU era | No,different telemetry mechanisms |
| Ryzen 1000 | Zen 1 | Yes, (limited) Package energy mainly |
| Ryzen 2000 | Zen+ | Yes, improved |
| Ryzen 3000 | Zen 2 | Yes, better domain support |
| Ryzen 5000 | Zen 3 | Yes, widely supported |
| Ryzen 7000 | Zen 4 | Yes, fully supported |
PowerGoblin currently only supports the Linux powercap framework for RAPL and does that via collectd and a third party plugin. Because the RAPL data can be used for malicious purposes, access to the powercap counter is usually (limited to the root user). Our configuration section describes a way to set up user access to the RAPL counters.
To include RAPL data in the measurements, first set up the configuration file (collectd.conf) with the following contents to collect the RAPL counter values:
Interval 0.1

LoadPlugin csv
LoadPlugin python

<Plugin csv>
  DataDir "/tmp/collectd"
  StoreRates false
</Plugin>

<Plugin python>
ModulePath "."
LogTraces true
Import "intel_rapl"
</Plugin>
The file uses an external Python script for extracting the RAPL data. Make sure Python is installed on the SUT (e.g. by launching python). Download the following intel_rapl.py script. The Python script and the configuration file should be located in the same directory.
On our test system the available RAPL counters are called counter-package-0 and counter-core. The counters measure energy, and use micro joules (µJ) as the unit of energy. The default collectd filters automatically include 'counter' for matching these counters.
Next we can continue using collectd.
NVML
Nvidia graphics cards support the reading of resource information and power consumption estimates via the NVML interface. Depending on the hardware support, NVML provides resource data and energy estimations for:
- GPU memory (
memory-used,memory-free), unit: bytes - GPU load (
percent-gpu_used), unit: percent - fan speed (
fanspeed), unit: rpm or percent (?) - temperature (
temperature-core), unit: °C - frequency (
frequency-multiprocessor,frequency-memory), unit: Hz - power (
power), unit: Watts
The information above was extracted from our test device (Geforce GTX 1080).
We currently only support reading the NVML data with collectd, which has built-in support for reading the data using APIs exposed by the official Nvidia drivers. Before the built-in support was added, there were third party collectd plugins for this purpose (e.g. #1, #2 & #3), but the built-in functionality is now recommended.
On Arch Linux, the collectd package from AUR did not have the necessary NVML support enabled. A custom package needs to be built to enable the support. First, make sure you have Nvidia drivers and CUDA installed on the SUT. Note that the driver and CUDA packages are rather large compared to most system packages. Use the following commands to build the utility:
$ curl https://visiiri.tt.utu.fi/powergoblin/collectd.tgz|tar xvfz -
$ cd collectd-archlinux/
$ makepkg -s
$ makepkg
$ makepkg -i
When measuring, the following configuration file (collectd.conf) contains the relevant parts for doing the measurements:
Interval 0.1

LoadPlugin csv
LoadPlugin gpu_nvidia

<Plugin csv>
  DataDir "/tmp/collectd"
  StoreRates false
</Plugin>
On our test system the exposed counters are called fanspeed, frequency-memory, frequency-multiprocessor, memory-free, memory-used, percent-gpu_used, and power. The memory counters are already included by the default filters. To include this data in the session files, the entry prefixes should be added to the list of logged resource types using the following API call:
echo fanspeed,frequency,percent,power|pg_post session/latest/resource/include
Another option is to configure the global application settings by adding the filters 'fanspeed', 'frequency', 'percent', 'power' to the global configuration file:
"memory-used", "memory-free", "memory-cached", "memory-buffered",
"if_octets", "disk_octets", "cpu-0-cpu-user", "cpu-0-cpu-system",
"cpu-0-cpu-idle", "counter",
"fanspeed", "frequency-memory", "frequency-multiprocessor",
"percent-gpu_used", "power"
The configuration is now ready, and we can continue using collectd.
Additional plugins
The following table shows the different variables that collectd supports measuring with different plugins:
| Plugin | Power | CPU | Memory | Network | Disk | Process |
|---|---|---|---|---|---|---|
| apc ups | X (ups) | |||||
| nut | X (ups) | |||||
| ted | X (power) | |||||
| mic | X (mic) | |||||
| battery | X (laptop) | |||||
| ipmi | X (ipmi) | |||||
| snmp | X (ipmi) | |||||
| mbmon | X (sensors) | |||||
| redfish | X (sensors) | |||||
| sensors | X (sensors) | |||||
| thermal | X (sensors) | |||||
| multimeter | X (multimeter) | |||||
| sigrok | X (multimeter) | |||||
| smart | X (hdd) | |||||
| hddtemp | X (hdd) | |||||
| wireless | X (wireless) | |||||
| gpu_nvidia | X (gpu) | |||||
| intel_rapl | X (rapl) | |||||
| cpu | X | |||||
| cpufreq | X | |||||
| xen | X | |||||
| turbostat | X | |||||
| contextswitch | X | |||||
| memory | X | |||||
| swap | X | |||||
| vmem | X | |||||
| buddyinfo | X | |||||
| dns | X | |||||
| interface | X | |||||
| iptables | X | |||||
| netlink | X | |||||
| ethstat | X | |||||
| madwifi | X | |||||
| disk | X | |||||
| df | X | |||||
| cgroups | X | |||||
| load | X | |||||
| processes | X | |||||
| dbi | X (db) | |||||
| virt | X | X | X | X |
Using collectd
First, make sure that all the collectd plugins required by the measurement's collectd configuration have been installed and are functional. This might require doing test runs before the actual measurement. Testing the script on another system does not imply it will automatically also work on the SUT. The syntax of the configuration file can be verified by running:
$ collectd -tT -C "$CONFFILE"
How to use collectd in conjunction with PowerGoblin? You will need to start collectd before doing the measurement and shut down the utility after the measurement:
$ collectd -f -C "$CONFFILE"
As mentioned in the collectd configuration above, the data will be collected to the directory tree under /tmp/collectd:
└-- mypc
    ├-- cpu-0
    |   ├-- cpu-idle-2024-11-11
    |   ├-- cpu-interrupt-2024-11-11
    |   ├-- cpu-nice-2024-11-11
    |   ├-- cpu-softirq-2024-11-11
    |   ├-- cpu-steal-2024-11-11
    |   ├-- cpu-system-2024-11-11
    |   ├-- cpu-user-2024-11-11
    |   └-- cpu-wait-2024-11-11
    ├-- intel-rapl
    |   └-- counter-core-2024-11-11
    |   └-- counter-package-0-2024-11-11
    ├-- interface-lo
    |   ├-- if_dropped-2024-11-11
    |   ├-- if_errors-2024-11-11
    |   ├-- if_octets-2024-11-11
    |   └-- if_packets-2024-11-11
    ├-- interface-lan
    |   ├-- if_dropped-2024-11-11
    |   ├-- if_errors-2024-11-11
    |   ├-- if_octets-2024-11-11
    |   └-- if_packets-2024-11-11
    ├-- load
    |   └-- load-2024-11-11
    └-- memory
    |   ├-- memory-buffered-2024-11-11
    |   ├-- memory-cached-2024-11-11
    |   ├-- memory-free-2024-11-11
    |   ├-- memory-slab_recl-2024-11-11
    |   ├-- memory-slab_unrecl-2024-11-11
    |   └-- memory-used-2024-11-11
    └── gpu_nvidia-0-NVIDIA GeForce GTX 1080
        ├── fanspeed-2024-11-11
        ├── frequency-memory-2024-11-11
        ├── frequency-multiprocessor-2024-11-11
        ├── memory-free-2024-11-11
        ├── memory-used-2024-11-11
        ├── percent-gpu_used-2024-11-11
        ├── power-2024-11-11
        └── temperature-core-2024-11-11
Before running the data collection, make sure the directory is empty to avoid contamination of the results. After the collection, the data should be compressed to a zip archive and uploaded to the PowerGoblin instance with the HTTP API. We should also synchronize the timestamps between the SUT and the PowerGoblin instance, because the clocks on both systems might not be in sync.
The PowerGoblin import functionality expects the exact directory structure (with relative paths) that is located under this directory path. That is, the root level should only contain a single folder with the SUT's hostname.
Example scripts
We provide an example project for performing measurements with collectd. The project utilizes the PowerGoblin library, which simplifies the code quite a bit compared to doing everything manually.
The following scripts are also provided for doing the measurement process without any external libraries. They start collectd as a background process. The scripts collect the log data in /tmp/collectd, compresses the directory tree into a zip archive, synchronizes the clocks, and uploads the file to the PowerGoblin instance (running at localhost:8080).
# requires coreutils, sh, curl, zip, collectd

msg_post() {
  curl -d@- http://$HOST/api/v2/$*
}
msg_post_file() {
  curl --data-binary "@$1" http://$HOST/api/v2/$2
}

# hostname and port of PowerGoblin
export HOST=localhost:8080

# start collecting resource data
mkdir -p /tmp/collectd
collectd -f -C collectd.conf &
PID=$!

# synchronize the clocks
date +%s%N | msg_post session/latest/sync

# stop collecting resource data and prepare the zip
kill $PID
pushd /tmp/collectd &> /dev/null
zip -qr collectd.zip *
popd &> /dev/null

# send the collectd data
msg_post_file /tmp/collectd/collectd.zip session/latest/import/collectd
# Requires Python 3+, python-requests,

import requests
import time
import shutil
import subprocess

class GoblinClient:
  def __init__(self, host):
    self.prefix = "http://" + host + "/api/v2/"

  def post_text(self, url, text):
    h = {'Content-Type': 'text/plain'}
    return requests.post(self.prefix + url, data=text, headers=h)

  def post_file(self, url, file):
    with open(file, 'rb') as p:
      h = {'content-type': 'application/x-zip'}
      return requests.post(self.prefix + url, data=p, verify=False, headers=h)

def milli_time():
  return str(round(time.time() * 1000))

c = GoblinClient("localhost:8080")

# start collecting resource data
p = subprocess.Popen(["/usr/sbin/collectd", "-fC", "collectd.conf"])

# synchronize the clocks
c.post_text("session/latest/sync", text = milli_time())

# stop collecting resource data and prepare the zip
p.terminate()
time.sleep(2)
shutil.make_archive("collectd", "zip", "/tmp/collectd/")

# send the collectd data
c.post_file("session/latest/import/collectd", "collectd.zip")
// requires Java 21+

import java.io.IOException;
import java.nio.file.*;
import java.net.http.*;
import java.util.zip.*;

record GoblinClient(String host) {
  private HttpResponse<String> run(HttpRequest.Builder b) throws Exception {
    try (var client = HttpClient.newHttpClient()) {
      return client.send(
          b.build(),
          HttpResponse.BodyHandlers.ofString()
      );
    }
  }

  private HttpRequest.Builder api(String api) {
      return HttpRequest.newBuilder(URI.create("http://"+host+"/api/v2/"+api));
  }

  HttpResponse<String> post(String api, String msg) throws Exception {
    return run(api(api).POST(HttpRequest.BodyPublishers.ofString(msg)));
  }

  HttpResponse<String> post(String api, Path path) throws Exception {
    return run(api(api).POST(HttpRequest.BodyPublishers.ofFile(path)));
  }

  void zipFile(File file, String fn, ZipOutputStream out) throws IOException  {
    if (file.isDirectory()) {
      var name = fn.endsWith("/") ? fn : fn + "/";
      out.putNextEntry(new ZipEntry(name));
      out.closeEntry();
      File[] children = file.listFiles();
      if (children != null)
        for (File child: children)
          zipFile(child, name + child.getName(), out);
    } else
      try(var fis = new FileInputStream(file)) {
        out.putNextEntry(new ZipEntry(fn));
        fis.transferTo(out);
      }
  }

  void zip(Path target, List<Path> source) throws IOException {
    try(var fos = new FileOutputStream(target.toFile());
      var out = new ZipOutputStream(fos)) {
      for (Path it : source) {
        var fileToZip = it.toAbsolutePath().toFile();
        zipFile(fileToZip, fileToZip.getName(), out);
      }
    }
  }
  void zip(Path target, Path source) throws IOException {
    zip(target, Files.list(source).toList());
  }
}

void main() {
  var c = new GoblinClient("localhost:8080");

  // synchronize the clocks
  c.post("session/latest/sync", "" + System.currentTimeMillis());

  // send the collectd data
  c.zip(Path.of("collectd.zip"), Path.of("/tmp/collectd/"));
  c.post("session/latest/import/collectd", Path.of("collectd.zip"));
}
const request = require('request');
const fs = require('fs');

const host = "localhost:8080";

function get(api) {
  request(
    "http://" + host + "/api/v2/" + api,
    (e, r, body) => {
      if (!e && r.statusCode == 200)
        console.log(body);
    }
  );
}

function post_json(api, data) {
  request.post(
    {
      url: "http://" + host + "/api/v2/" + api,
      json: data,
    },
    (e, r, body) => {
      if (!e && r.statusCode == 200)
        console.log(body)
    }
  );
}

function post_file(api, file) {
  fs.createReadStream(file).pipe(
    request.post(
    {
      url: "http://" + host + "/api/v2/" + api
    },
    (e, r, body) => {
      if (!e && r.statusCode == 200)
        console.log(body)
    }
    )
  );
}

// synchronize the clocks
post_json("session/latest/sync", +new Date());

// send the collectd data
post_file("session/latest/import/collectd", "collectd.zip")
// Requires Java 21+

import java.nio.file.*
import java.net.*
import java.net.http.*
import java.util.zip.*
import java.io.*

class GoblinClient(val host: String) {
  private fun run(b: HttpRequest.Builder) =
    HttpClient.newHttpClient().use {
      it.send(
        b.build(),
        HttpResponse.BodyHandlers.ofString()
      )
    }

  private fun api(api: String) =
    HttpRequest.newBuilder(URI.create(("http://$host/api/v2/$api")))

  fun get(api: String) = run(api(api))

  fun post(api: String, msg: String) =
    run(api(api).POST(HttpRequest.BodyPublishers.ofString(msg)))

  fun post(api: String, path: Path) =
    run(api(api).POST(HttpRequest.BodyPublishers.ofFile(path)))
}

fun zipFile(fileToZip: File, fileName: String, out: ZipOutputStream) {
    if (fileToZip.isDirectory) {
        val name = if (fileName.endsWith("/")) fileName else "$fileName/"
        out.putNextEntry(ZipEntry(name))
        out.closeEntry()
        val children = fileToZip.listFiles() ?:
          throw IOException("Error opening [$fileToZip]")
        for (child in children)
            zipFile(child, name + child.name, out)
    } else
        FileInputStream(fileToZip).use { fis ->
            out.putNextEntry(ZipEntry(fileName))
            fis.transferTo(out)
        }
}

fun zip(destinationFile: Path, sourceDirs: List<Path>) {
    FileOutputStream(destinationFile.toFile()).use { fos ->
        ZipOutputStream(fos).use { zipOut ->
            sourceDirs.forEach {
                val path = it.toAbsolutePath()
                val fileToZip = path.toFile()
                zipFile(fileToZip, fileToZip.name, zipOut)
            }
        }
    }
}

// --- Examples ---

var c = GoblinClient("localhost:8080")

// synchronize the clocks
c.post("session/latest/sync", "" + System.currentTimeMillis())

// send the collectd data
zip(Path.of("collectd.zip"), Path.of("/tmp/collectd/"))
c.post("session/latest/import/collectd", Path.of("collectd.zip"))