Power

Goblin




Locating the session data
By default, PowerGoblin stores the past session data in the logs/ directory inside the application's work directory. We can study the contents of the directory vie the web user interface:
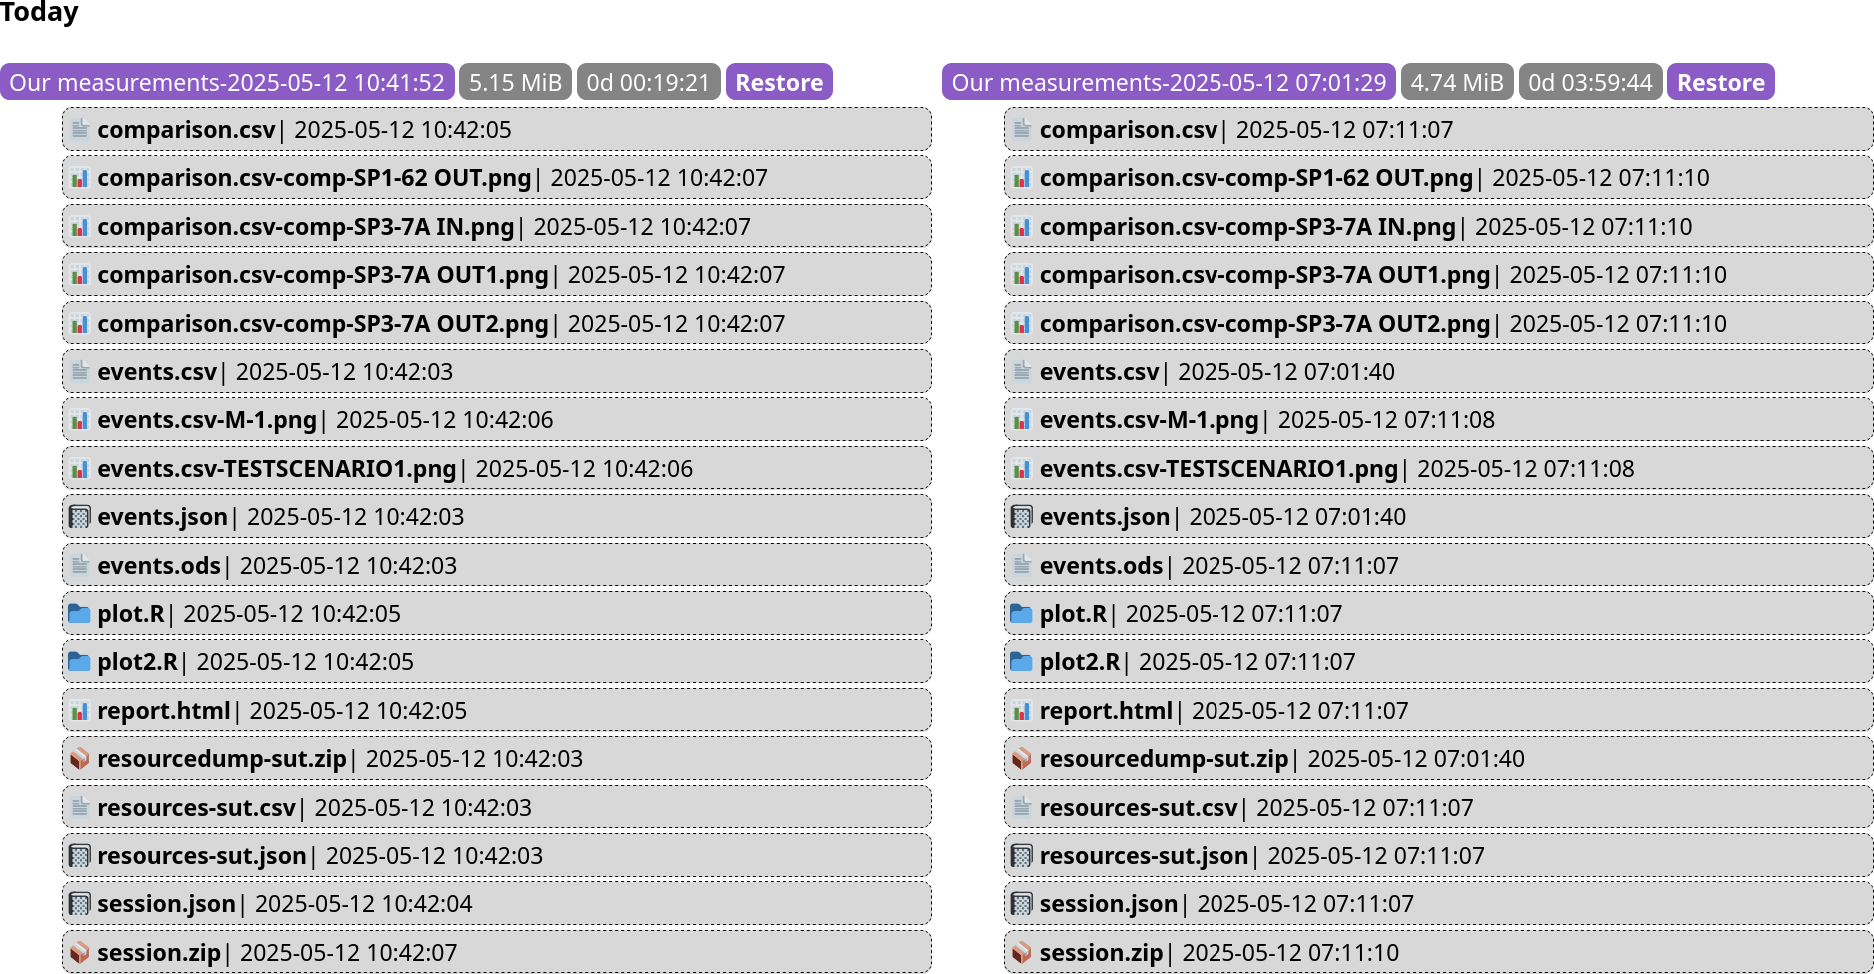
The different files have the following meaning:
| File | Enabled by | Description |
|---|---|---|
errors.log |
A textual log of measurement errors and other messages. | |
events.csv |
Logged events of the measurements in (processed) CSV format. | |
events.json |
Logged events of the measurements in serialized JSON format. Used for reconstructing the previous session. | |
measurement.md |
An archived copy of the measurement plan / document template for the energy report. | |
plot.R |
writePlotScripts | R script for drawing scatter plots from events.csv. |
plot2.R |
writePlotScripts | R script for drawing box plots from comparison.csv. |
report.html |
writeReport | An HTML/JS report of the measurement session. Reads session.js, statistics.js, scatter-meter.js, and scatter-resource.js. |
report2.html |
writeReport | An HTML/JS report of the measurement session. Since the meter/measurement configurations can be quite complex for some sessions, the report has interactive functionality for switching between different visualizations. The file is self-contained; all JS, CSS, and image resources are included in the HTML file. |
resources-UNITNAME.csv |
Logged resource data from unit UNITNAME in (processed) CSV format. |
|
resourcedump-UNITNAME.zip |
writeDumps | An archived copy of the latest received resource dump file. |
scatter-meter.js |
A set of scatter plot data for all meters in JSON format. Needed by report.html. |
|
scatter-resource.js |
A set of scatter plot data for all resources in JSON format. Needed by report.html. |
|
session.json |
Session summary data in JSON format. Used when reconstructing the previous session. The user interface will label a session as corrupted if the file is missing or incompatible. | |
session.js |
Session summary data in JSON format. Needed by report.html. |
|
session.ods |
writeSpreadsheet | A session report in OpenDocument format. |
session.zip |
An archive of the whole session containing all previously mentioned files (except the resource dump ZIP). Useful for downloading and analyzing the results elsewhere. | |
statistics.csv |
A set of statistics for each meter and resource in CSV format. | |
statistics.js |
A set of statistics for each meter and resource in JSON format. Needed by report.html. |
|
| asset files | All files linked to from the measurement.md. Needed by report.html. |
Session summary
The session summary file contains necessary information to reconstruct the previously organized measurement session.
JSON data schema
The JSON data is generated from the data classes located in the fi.utu.tech.powergoblin.data package. If you wish to extend the functionality of the application or build compatible tools, please refer to the source code in this package.
The strongly typed and well documented Kotlin representations work as schemas. See the unit test SerializationTest for examples of serialization and deserialization using these schemas.
The appName and appVersion fields in the InstanceSpecs (in InstanceSummary) and version in SessionSummary represent the schema version. In the future, the UI is expected to inform about incompatible JSON schemas.
Event logs
The event logs contain serialized data about the past events in the session. Since the logs can grow relatively large, the files are written incrementally, one line at a time. This is especially important to note when parsing the JSON files as the events are not stored as a single array.
JSON data schema
The JSON data is generated from the data classes implementing the Event interface, located in the fi.utu.tech.powergoblin.data package. See the unit test SerializationTest for examples of serialization and deserialization using these schemas.
CSV data
The event data in CSV format looks like this:
default;2025-05-11 12:00:00;user
Measurement,Run,Timediff,TimediffRun,Meter,Channel,MonotonicTime,Unixtime,Metertime,Voltage,Current,Power,Energy,Online
1,0,14,0,TRIGGER,RUN,192804700304783,1747021042224,NA,NA,NA,NA,NA,NA
1,1,16,2,SP3-7A4B3DD6B19C5649C943DCBA0AA751D3,OUT1,192804702540807,1747021042226,709414612,0,1,0,NA,FALSE
1,1,16,2,SP3-7A4B3DD6B19C5649C943DCBA0AA751D3,OUT2,192804702541327,1747021042226,709414612,0,1,0,NA,FALSE
The CSV fields have the following meaning:
| Field | Description |
|---|---|
| Measurement | Measurement id (integer; 1, 2, ...) |
| Run | Run id (integer; implicit id = 0) or 'NA' (no active run) |
| Timediff | Time diff between the beginning of the session and current event |
| TimediffRun | Time diff between the beginning of the measurement and current event or NA (no active run) |
| Meter | Machine generated name of the meter or 'NA' (trigger event) |
| Channel | Name of the meter's channel (driver dependent) or 'NA' (trigger event) |
| MonotonicTime | High precision time stamp (may wrap around) |
| Unixtime | The Unix time stamp of the PowerGoblin instance |
| Metertime | Time stamp extracted from the meter (driver dependent format) or 'NA' |
| Voltage | Voltage value in millivolts or 'NA' |
| Current | Current value in milliamps or 'NA' |
| Power | Power value in milliwatts or 'NA' |
| Energy | Cumulative energy value or 'NA' (not measured) |
| Online | Indicates whether the meter's channel and/or meter is active or 'NA' (trigger event) |
In the future, the CSV schema may change without further notice. In this age of AI tools and even spreadsheet imports & exports, converting between different CSV formats with explicit column headers should not be too difficult.
ODS data
TODO: in a future version the spreadsheet will only contain the summaries due to the memory issues. Currently, it contains the logs and has memory issues with long sessions.
The ODS file has two sheets. The first contains the name, date, and other summary data describing the session. The second sheet contains the same CSV data as the CSV file split in 15 columns for easier processing.
The ODS spreadsheet, however, is written in a non-incremental way. This basically means that it shouldn't be used if the session can grow too large to fit in memory.
Statistics data
The statistics data in CSV format looks like this:
System utility benchmarks;2026-06-03 10:09:41;Captain Planet
Measurement,Datasource,Category,Quantity,Unit,Min,Max,Avg,StdDev
1,null,Other,Total time,ms,2006.0,2007.0,2006.5,0.5
1,RAPL/sut-package-0,Meter,Total energy,µJ,2.30040959E8,2.39857881E8,2.340965475E8,3646126.603227972
1,RAPL/sut-package-0,Meter,Power,mW,114676.45014955134,119570.2298105683,116669.21234179873,1824.5682302201471
1,RAPL/sut-core,Meter,Total energy,µJ,3890623.0,6238707.0,4945129.75,1013707.2567490515
1,RAPL/sut-core,Meter,Power,mW,1939.4930209371885,3108.473841554559,2464.4323252216445,504.60679850195515
1,sut/interface-lo:if_octets,Resource,Transferred data,B,1066979.0,1193647.0,1109041.75,49579.04991715251
1,sut/interface-lo:if_octets:1,Resource,Transferred data,B,1066979.0,1193647.0,1109041.75,49579.04991715251
1,sut/interface-bond0:if_octets,Resource,Transferred data,B,0.0,0.0,0.0,0.0
The CSV fields have the following meaning:
| Field | Description |
|---|---|
| Measurement | Measurement id (1, 2, ...) |
| Datasource | Either meter/channel or unit/resource |
| Category | Meter/Resource/Other |
| Quantity | Textual representation of the quantity, e.g. Power |
| Unit | Unit of the quantity, e.g. mW |
| Min | Minimum value (double) |
| Max | Maximum value (double) |
| Avg | Average value (double) |
| Stdev | Standard deviation value (double) |
Measurement report
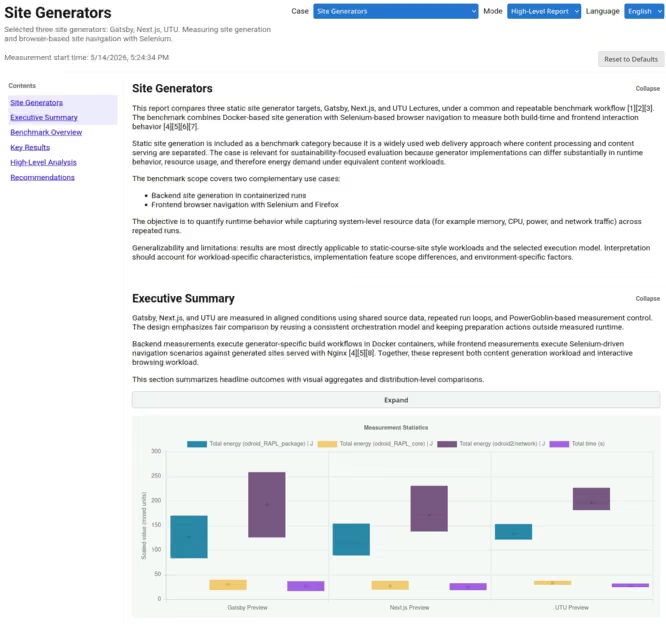
The measurement results are compiled into a measurement report. It includes an interactive user interface designed to provide both a general overview and a technically detailed view of the software’s energy consumption measurement results. The report is designed so that the same measurement data serves several different user groups: software developers, researchers, educational institutions, and organizations that evaluate the energy efficiency of their systems.
The purpose of the reporting view is not merely to present individual measurement results, but also to support the interpretation, comparison, and further analysis of measurement data. In particular, when it comes to energy measurements, a single value is rarely sufficient without context, as energy consumption depends heavily on the measurement environment, the load, the hardware, the timing, and the underlying software and operating system components.
User interface
At the top of the report interface are three main options: Language, Case, and View. The language setting changes the language of the report interface and interactive components.
The Case option determines which measurement case is being viewed. By default, there is only one case, but reports from different measurements can be compiled into a shared database from which to select the desired case. All graphs, tables, and analyses are updated according to the selected case.
The View selection offers two different levels of reporting views: High-Level Report and Technical Report. The former focuses on the measurement’s area of application, the key results, and summarized conclusions. The goal is to provide an easily understandable summary even for users who do not have in-depth background in energy measurements or software system performance analysis.
The Technical Report includes a more detailed description of the measurement system and the measurement methodology. The report may also describe factors related to measurement repeatability, such as buffer handling, temperature stabilization, control of background processes, and calibration of measurement equipment. These factors are particularly important in energy measurements, where even small changes in the environment can affect the results.
Box Plots
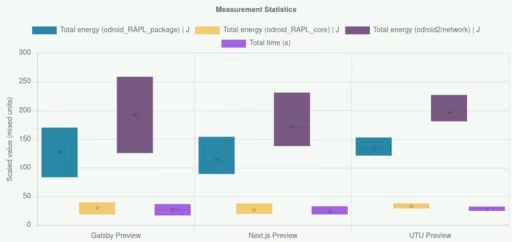
The box plot serves as the default view in the reporting tool because it offers a concise and statistically informative way to compare different measurement targets. In energy measurements, a single measurement result is usually not sufficient to describe the system’s behavior reliably; instead, multiple repetitions are needed to assess variability.
Summary table
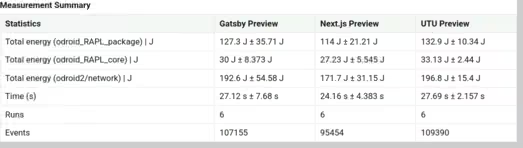
A table of results provides the same data as a boxplot, but in numerical form. The table includes statistical minimums, maximums, means, and standard deviations, as well as the name of the measured variable and its description. When evaluating energy consumption, the mean alone is often not a sufficient indicator. Especially in software measurements, distributions can be skewed or contain random spikes, in which case the median and measures of dispersion are often more informative. The table can be used to identify potential errors, such as missing measurement runs or meter readings, unrealistic values, and individual outlier measurements.
Raw data
The tabular format allows for a somewhat more detailed analysis than graphs, and the aggregated results data can be used as-is in reporting. If you wish to analyze the results data in greater detail using external statistical tools, we recommend reading the metric data from the JSON-formatted raw data stored in the database.
Scatter plots
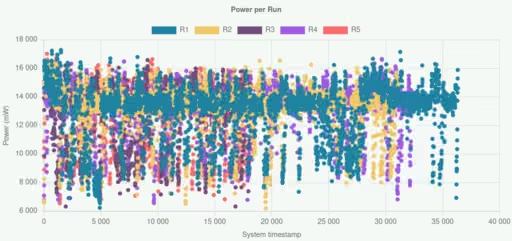
A scatter plot allows you to examine individual measurement runs over time. Unlike a box-and-whisker plot, which summarizes results in a statistical format, a scatter plot shows the dynamic behavior of the measurement and instantaneous changes.
By default, the scatter plot displays power as a function of time, because instantaneous power consumption often reveals more about the software’s internal behavior than just total energy. Furthermore, many performance-related issues manifest themselves specifically as momentary power spikes or uneven resource utilization. The graph is therefore well-suited for detailed analysis of measurement runs.
Node data
In case the measurement session is done using the PowerGoblin agents, detailed specifications of the nodes are automatically collected from the nodes and appended to the measurement session logs. A selection of useful specifications can also be rendered in the report.
Plots
TODO: the plot generation with R has not been updated since PowerGoblin 1.0. This feature needs more work!
If R and/or Docker have been set up properly and plot generation has been enabled, the log directory should also contain .png files for each measurement (scatter plots of stacked runs) and for each meter (box plots comparing the measurements).
The source files (*.R) for generating the plots are also stored in the session directory. These are provided as a useful starting point for generating plots for publications.