Power

Goblin
![]()
![]()
![]()
![]()
The measurement methodology of the Visiiri project is based on the same basic idea as in the previous MitViDi project, but we have built more versatile tool support for this process. In addition, we have expanded the documentation to cover different measurement case architectures.
Framework
This section of the guide describes the empirical measurement framework for power consumption. The power consumption of an information system is a large conceptual ensemble that can be observed both at the level of individual components and subsystems and at the macro level. A rough (conservative) estimate of the power consumption can be obtained from the hardware specification of the system, but also from the billing of usage and, for example, the operating time of battery-powered devices. However, accurate determination of consumption often requires systematic power measurement during the system development and/or operation.
The measurement scheme developed in the MitViDi project allows both manual and automatic measurements of the system under assessment. The system to be evaluated is representative of the actual production system, which allows obtaining accurate power measurements that can be scaled back to the production environment. The study describes the advantages and limitations of the solution and the potential for generalising the arrangement. If necessary, the measurement can be repeated to support statistical analysis. The described arrangement includes the mapping of the measurement equipment and software, the definition of the physical measurement setup and software, the design of the measurements and the processing of the results. The description of the measurement setup is based on the study and research work carried out at the University of Turku in the MitViDi project.
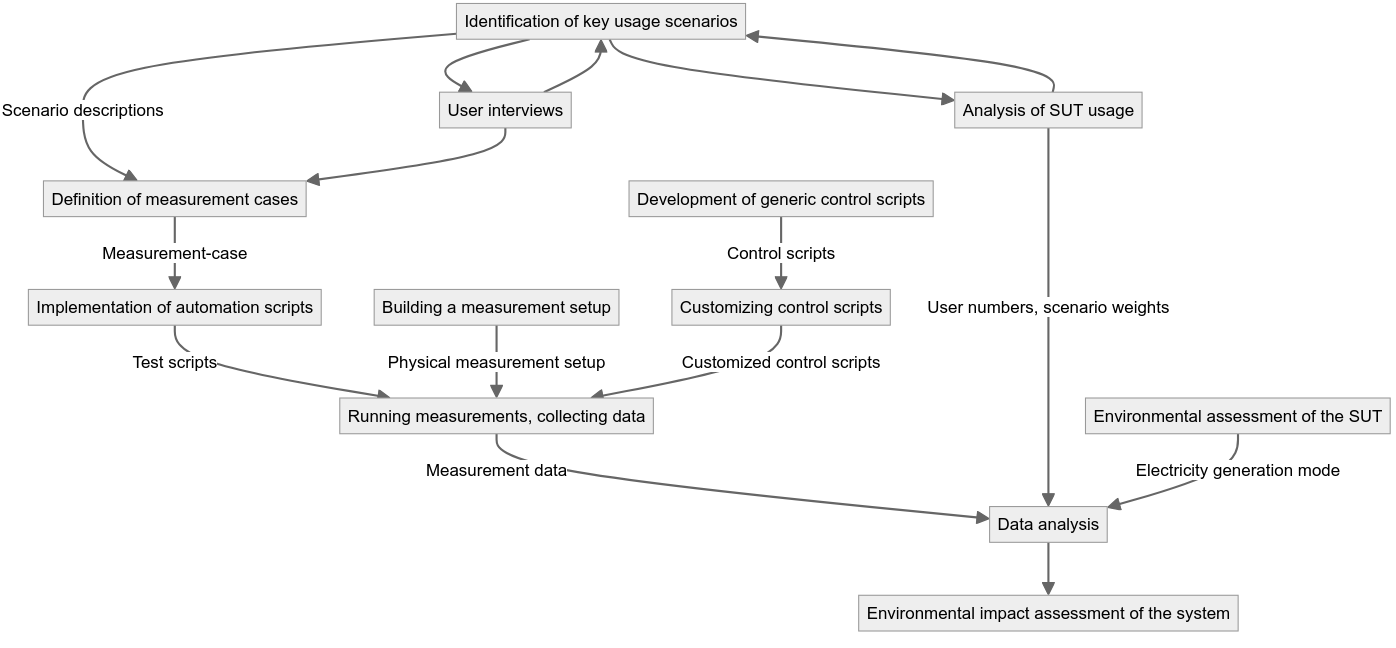
Measurement process
The simple process of power measurement includes the definition of measurement cases from the system usage scenarios, measurement scheduling and the construction of the associated scripts and the execution of the measurements. The resulting measurement data is analysed and, if necessary, used to identify new usage scenarios. The process is described below:
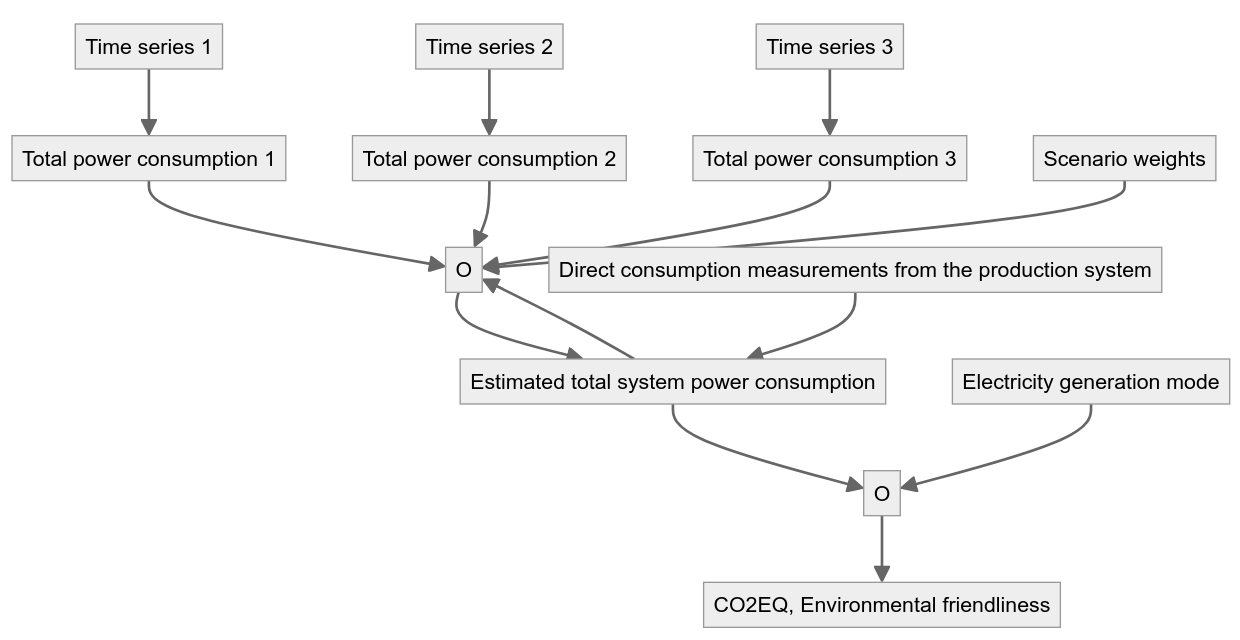
Measurement plan
The time series of the different measurements together with the weights of the measurements can be used together with the consumption measurements of the generation system to generate an estimate of the total power consumption of the system. Taking into account the electricity generation mode, an assessment of the environmental performance and CO2 equivalence of the software can be made.
The measurement plan for power measurement uses the MitViDi measurement methodology, for example for a rough estimation of the power consumption caused by the overall use of the software. The aim is both to test the performance of the power measurement and to gather information on the environmental performance of different software.
Measurement script
In practice, based on the usage scenarios, a measurement script is written that mimics human user behaviour as closely as possible but runs automatically, repeating the same operations each time. These are run on the system under test, during which the usage scenarios are repeated dozens of times. This means that the test user of the measuring instrument must be able to access the functionalities performed in the scenarios without problems.
The usage section of the manual contains various examples of measurement scripts as part of different examples of measurement configurations.
Measurement data
The measurement data during the usage scenarios can be used to make rough estimates of the power consumption caused by the usage, for example to see how stable the system is in terms of power consumption when performing the same functions. The scenarios are generated by estimating the main user groups of the system to be measured and the results are weighted by the most important and most frequent scenarios or activities.
It may be desired to collect all available resource usage data from the background system for the duration of the test run. In particular, data on server resource consumption during to test scenarios is valuable in addition to the power consumption data. Processor, main memory and data traffic usage are the most significant drivers of environmental impact, so with these alone it is also possible to roughly estimate the power consumption incurred. These are retrieved through the measured server environment.
Architecture description of a measurement
In this section, we look at two examples of measurement architecture.
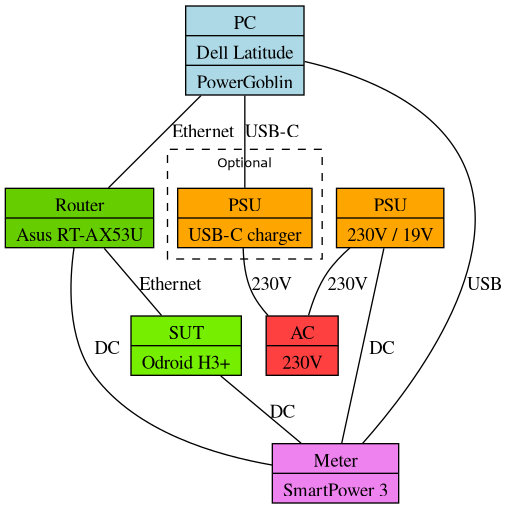
The following figure shows this simple measurement setup. Essentially, our simple measurement setup consists of the following units:
- Controller PC (Dell Latitude notebook)
- SUT (Odroid H3+)
- Router (Asus RT-AX53U)
- Power meter (Odroid SmartPower 3)
The architecture diagram also depicts all the necessary connections between the units and the power supply units (PSU), both for the notebook and the power meter. When using battery power, the PSU for the notebook is optional, assuming there is enough battery life for performing the measurement.
This hardware architecture enables us to measure the power consumption of both, the SUT and the Router, since our power meter has two independent output channels with adjustable voltage output. The SUT is powered with 17,8 Volts whereas the Router requires exactly 12 Volts.
The controller PC runs a PowerGoblin instance to coordinate the measurement and to collect the measurement data. The readings from the power meter are collected directly via USB. The meter functions as a serial device and sends the data in CSV format, which is further processed by PowerGoblin. In addition, different software based resource data can be collected from the SUT with collectd (*). This data is stored in a RAM disk on the SUT during the measurement, and uploaded to PowerGoblin after the measurement. Alternatively, the collectd data can be stored on disk or piped via a socket connection. We think that both of these approaches introduce more resource overhead.
(*) in theory, similar data could be collected from the router as well, but many routers do not have resources and/or software support for collectd or similar data aggregators).
The following figure shows a more complex measurement setup than this step:
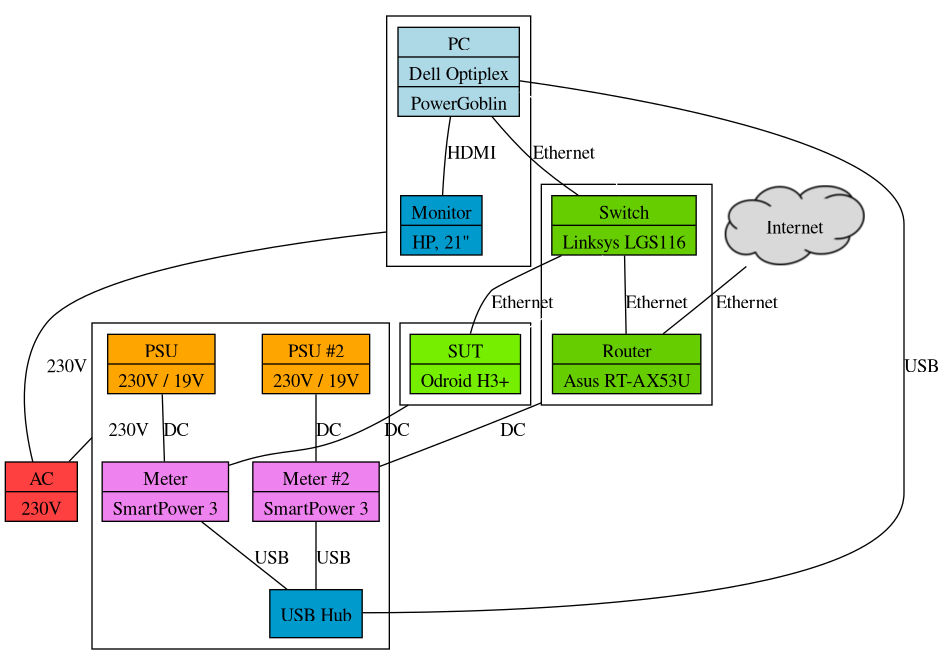
In this more complex measurement setup, the configuration now has more units than the earlier setup for different purposes. This setup is actually based on the configuration in the measurement laboratory at the University of Turku.
The PC and monitor serve the same purpose of running the PowerGoblin software. In addition, there are two meters for measuring power. The first measures the system under test (SUT), namely the Odroid single board computer. The second meter is measuring the power consumption of the network router and switch. Since there are three devices to be measured, a single meter with a single or dual channel output would not be sufficient. In addition, the Odroid system is powered with 17,8 Volts whereas the network devices require exactly 12 Volts.
In this setup, the meters are also connected to the PC via a USB hub. This is because in our lab setup there are more connected meters than free USB ports in the host PC. A similar rationale is behind the addition of the switch -- the router we use only has five ports and there are more network connected devices in the laboratory. The router also provides a firewall and access to internet and connects the SUT and the PC running PowerGoblin for easier coordination of the measurements.
The usage section of the manual contains various examples of architecture descriptions as part of different examples of measurement configurations.